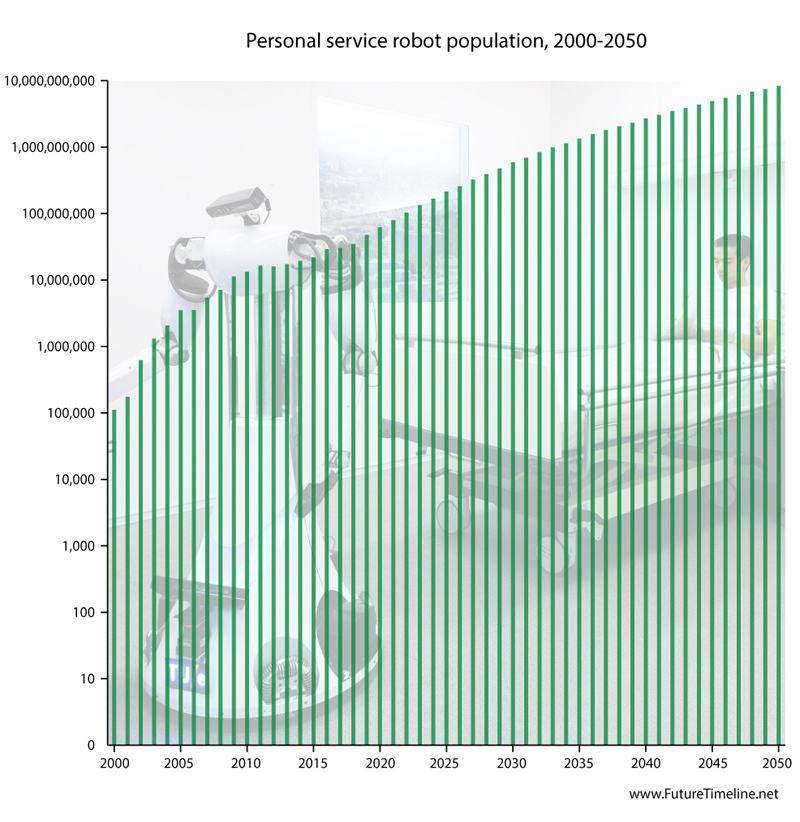
Personal service robot population, 2000-2050 This graph shows past, present and estimated future numbers of personal service robots operational around the world from 2000 to 2050 – such as hospital, hotel and retail machines, and domestic consumer robots. The graph uses a logarithmic scale. It does not include industrial robots.
Sources: United Nations Economic Commission for Europe (UNECE) International Federation of Robotics (IFR) Ethics and Information Technology
Posted: 18th December 2017. Last updated: 18th December 2017.
If you enjoy our content, please consider sharing it:
|