future timeline technology singularity humanity
 
Features »


Data & trends


9th October 2022

A timeline of global warming, 10,000 BC-2100 AD

This graph shows how global average temperatures have changed over the millennia – from the end of the ice age, to the Industrial Revolution and through to the present day, with a future projection to 2100.

Read more...

1


25th August 2022

Global average Internet speed, 1990-2050

This graph shows the global average Internet speed from 1990 to the present day, with a future trend projected to 2050.

Read more...

1


29th July 2022

Economic losses from weather-related events, 1970-2060

This graph shows the worldwide economic losses from weather-related events, from 1970 to the present day, with a future trend projected out to 2060.

Read more...

1


22nd March 2022

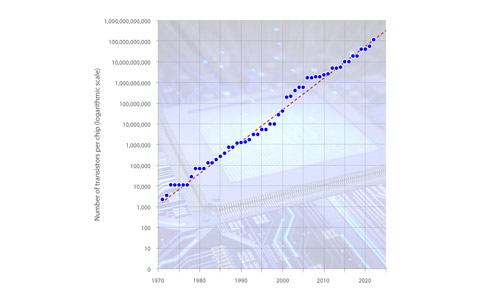
Moore's Law (2022 update)

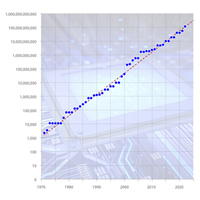
These two graphs illustrate the exponential growth in chip transistor counts, from 1971 to the present day, with a future projection until 2100. We have updated them to include data from 2019 to 2022.

Read more...

1


future timeline

8th February 2022

Telecommunications bit rates 1798-2120

This graph shows the progress in telecommunications bit rates over the last two centuries, and a future extrapolation to the 22nd century.

Read more...

future timeline


future timeline

9th August 2021

Supercomputers – future predictions

Future predictions of supercomputing power are presented here. This graph shows how these machines have developed from the early 1990s through to the present day, with a predicted future trend to 2055.

Read more...

future timeline


future timeline

28th March 2021

Virtual reality – future trends

The quality of VR headsets has improved exponentially since the 1990s. These graphs illustrate how the rapid improvements are likely to continue in the coming decades, with graphical resolutions practically indistinguishable from real life by 2040.

Read more...

future timeline


future timeline

1st December 2020

Quantum coherence times, 2000-2040

Coherence times in quantum computing have increased by orders of magnitude since the early 2000s. If this exponential progress continues, coherence times measured in seconds or even minutes could be achieved in the near future.

Read more...

future timeline


future timeline

8th November 2020

China – carbon emissions, 1950-2060

China has pledged to go carbon neutral by 2060. This graph shows how it might achieve that long-term goal.

Read more...

future timeline


future timeline

29th December 2019

Units of time – orders of magnitude

The diagram here shows different measurements of time – from a yoctosecond (extremely short), to a yottasecond (extremely long), with a midpoint of one second.

Read more...

future timeline


future timeline

19th November 2019

World electricity sources, 1990-2100

This graph shows the progress in clean energy from 1990 to 2100. It suggests that fossil fuels could be obsolete for generating electricity by 2078.

Read more...

future timeline


future timeline

11th August 2019

Bionic eye technology, 2000-2050

This graph shows the progress in bionic eye technology. It suggests that a retinal implant with pixel resolution equivalent to a human eye could be achieved by 2048.

Read more...

future timeline


16th June 2019

Global meat consumption by type, 2025-2055

This graph shows the rapid change in meat production over the coming decades.

Read more...

1


6th June 2019

Urban population, 1950-2100

On current trends, around 68% of people are expected to live in urban areas by 2050 and 85% by 2100.

Read more...

1


30th March 2019

Cellular frequencies, 1980-2040

This graph shows the progress in mobile cellular frequency ranges, from the first generation in the 1980s to the sixth generation that is predicted for the 2030s.

Read more...

1


« Previous