18th May 2019 Nearly a quarter of West Antarctic is now unstable A study by the University of Leeds reveals nearly a quarter of the West Antarctic Ice Sheet is now unstable, with melt rates up to five times faster than 25 years previously.
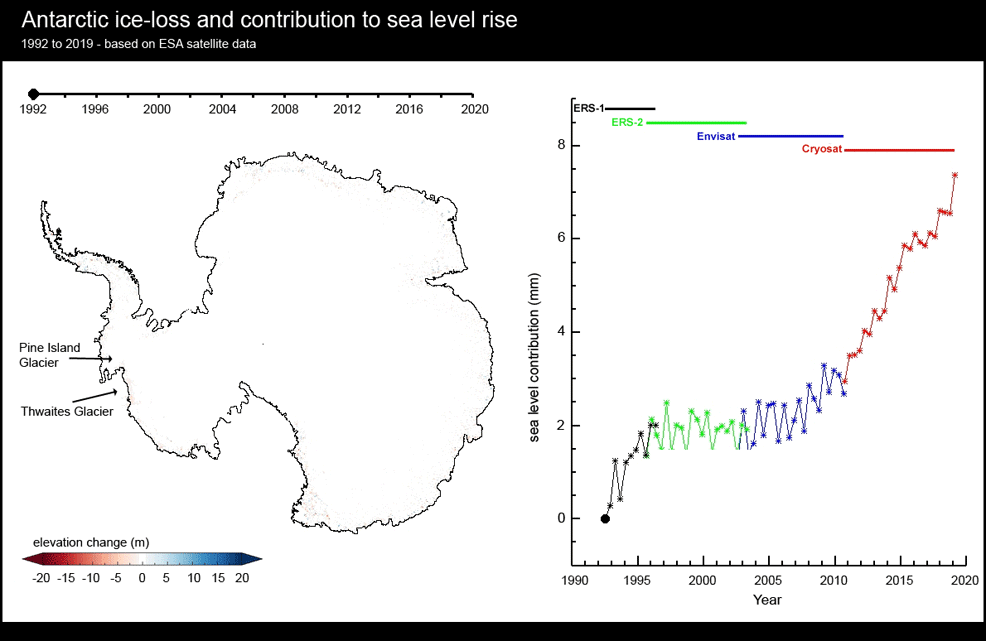
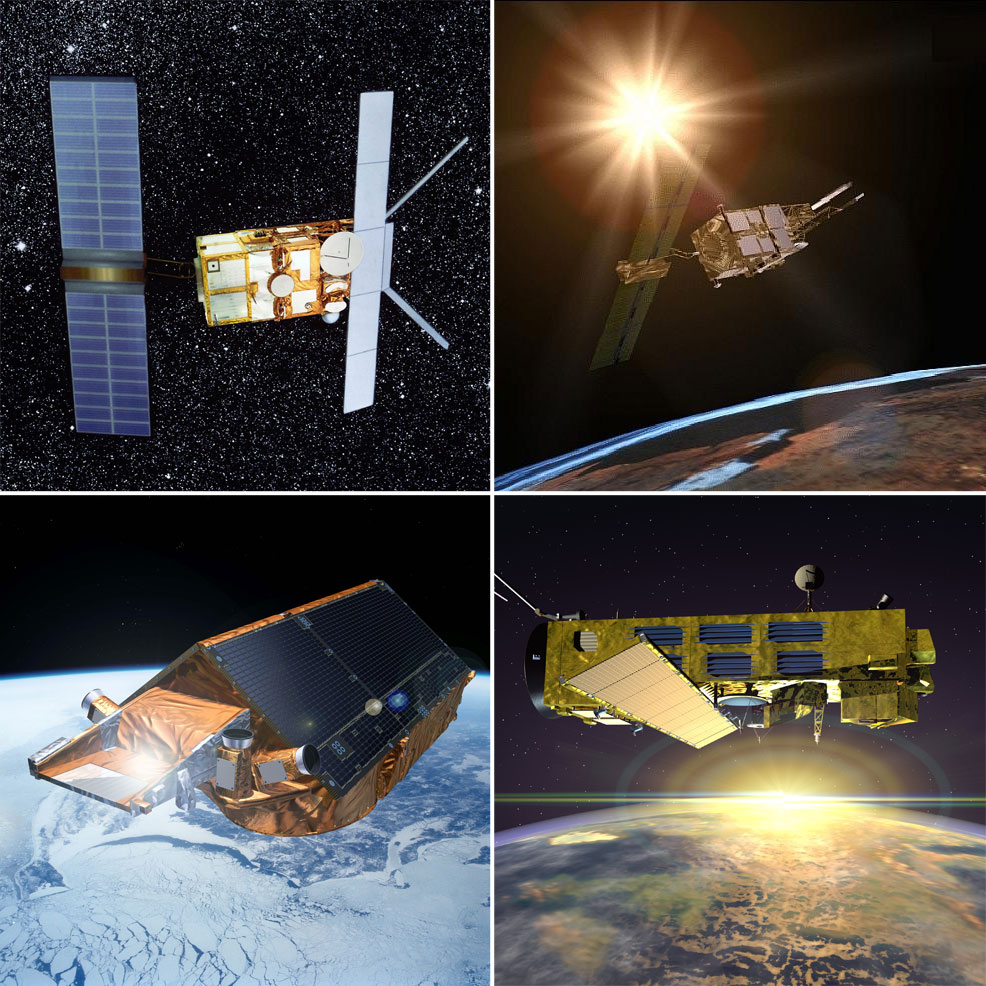
In only a quarter of a century, ice thinning has spread across West Antarctica so rapidly that 24% of the region is now affected, according to a new study published this week in Geophysical Research Letters. By combining 25 years of satellite altimeter measurements and a model of the regional climate, the UK Centre for Polar Observation and Modelling (CPOM) has tracked changes in snow and ice cover across the continent. Researchers led by Professor Andy Shepherd, from the School of Earth and Environment at the University of Leeds, found that Antarctica's ice sheet has thinned by up to 122 m (400 ft) in places. The most rapid changes are occurring in West Antarctica, where ocean melting has triggered glacier imbalance. This means the affected glaciers are unstable, as they are losing more mass through melting and iceberg calving than they are gaining through snowfall. Shepherd's team found that the majority of the largest ice streams – including the massive Pine Island and Thwaites glaciers – are now losing ice five times faster than they were at the start of the survey. More than 800 million measurements of Antarctic ice sheet height were recorded by the ERS-1, ERS-2, Envisat and CryoSat-2 satellites between 1992 and 2017.
Alongside this, the RACMO regional climate model was used to accurately produce simulations of snowfall over the same period. All of the data has been made freely available online. Together, these measurements allow changes in the ice sheet height to be separated into those due to weather patterns, such as less snowfall, and those due to longer term changes in climate, such as increasing ocean temperatures that eat away ice. "In parts of Antarctica, the ice sheet has thinned by extraordinary amounts – and so we set out to show how much was due to changes in climate and how much was due to weather," said Professor Shepherd.
To do this, the team compared the measured surface height change to the simulated changes in snowfall, and where the discrepancy was greater they attributed its origin to glacier imbalance. They found that fluctuations in snowfall tend to drive small changes in height over large areas for a few years at a time, but the most pronounced changes in ice thickness are signals of glacier imbalance that have persisted for decades. "Knowing how much snow has fallen has really helped us to detect the underlying change in glacier ice within the satellite record," Shepherd explained. "We can see clearly now that a wave of thinning has spread rapidly across some of Antarctica's most vulnerable glaciers, and their losses are driving up sea levels around the planet. Altogether, ice losses from East and West Antarctica have contributed 4.6 mm to global sea level rise since 1992." In total, West Antarctica has enough ice to raise global sea levels by 4 m (13 ft). The east of the continent holds an even greater amount – it would contribute almost 61 m (200 ft). One of the key questions for scientists is how fast the region's ice could decline in the future, and this study may help to improve their estimates for this century and beyond. "This is an important demonstration of how satellite missions can help us to understand how our planet is changing," said Dr Marcus Engdahl of the European Space Agency, a co-author of the study. "The polar regions are hostile environments and are extremely difficult to access from the ground. Because of this, the view from space is an essential tool for tracking the effects of climate change."
Comments »
If you enjoyed this article, please consider sharing it:
|