13th May 2020 COVID-19 lockdowns impacting global air quality Levels of two major air pollutants – nitrogen dioxide (NO2) and particulate matter (PM) – have been drastically reduced since lockdowns began in response to the COVID-19 pandemic. However, a secondary pollutant – ground-level ozone – has increased in China. Two new studies published in Geophysical Research Letters, a journal of the American Geophysical Union (AGU), find that nitrogen dioxide (NO2) pollution over northern China, Western Europe and the U.S. has decreased by as much as 70% in early 2020 as compared to the same time last year. NO2 is a highly reactive gas produced during combustion that has many harmful effects on the lungs. It typically enters the atmosphere through emissions from vehicles, power plants and industrial activities. In addition to NO2, one of the new studies finds particulate matter pollution (particles smaller than 2.5 microns) has decreased by 35% in northern China. Particulate matter consists of solid particles and liquid droplets that are small enough to penetrate deep into the lungs and cause damage. The two new papers are part of an ongoing special collection of research in AGU journals related to the current pandemic.
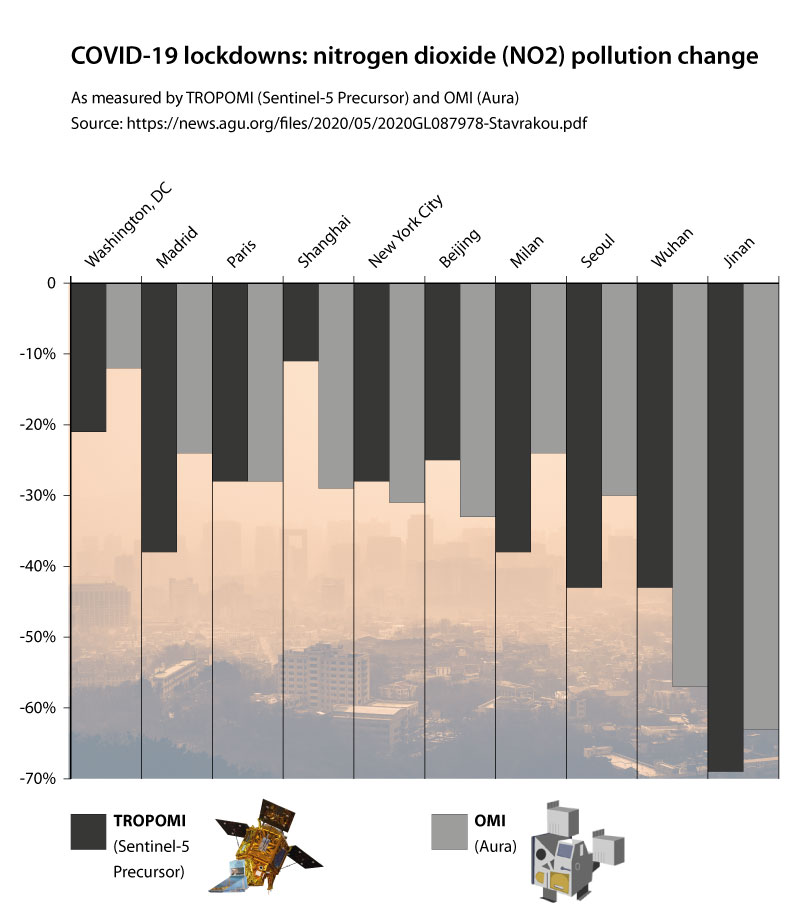
Such a huge drop in emissions is unprecedented since air quality monitoring from satellites began in the 1990s, say the study authors. The only comparable events are short-term falls during events like the 2008 Beijing Olympics, when China imposed strict emissions regulations. These improvements in air quality will likely be temporary, but give scientists a glimpse into what air quality could be like in the future, when emission regulations are far more stringent. "Maybe this unintended experiment could be used to understand better the emission regulations," said Jenny Stavrakou, atmospheric scientist at the Royal Belgian Institute for Space Aeronomy in Brussels and co-author of the first paper. "It is some positive news among a very tragic situation." Stavrakou and her colleagues used satellite measurements to estimate the changes in nitrogen dioxide pollution over the major epicentres of the outbreak: China, South Korea, Italy, Spain, France, Germany, Iran and the United States. They found that nitrogen dioxide pollution decreased by an average of 40% over Chinese cities and 20 to 38% over Western Europe and the United States during the 2020 lockdown, as compared to the same time in 2019. Observations from two high-resolution instruments – TROPOMI onboard Sentinel-5 Precursor and OMI on Aura – provided the data, with averages calculated within a 100 km radius around the city centres. The highest recorded fall was in Jinan, capital of China's Shandong province, where the TROPOMI instrument registered a massive 69% decline. A full list of cities is available in the paper.
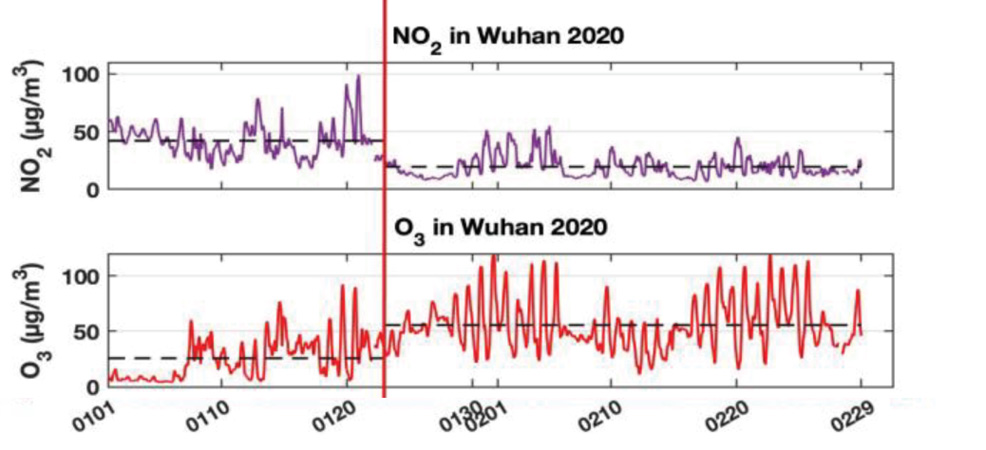
However, the drop in nitrogen dioxide pollution has caused an increase in surface ozone levels in China, according to the second study. Ozone (O3) is a secondary pollutant formed when sunlight and high temperatures catalyse chemical reactions in the lower atmosphere. Ozone is harmful to humans at ground level and causes pulmonary and heart disease. In highly polluted areas, particularly in winter, surface ozone can be destroyed by nitrogen oxides, so ozone levels can increase when nitrogen dioxide pollution goes down. As a result, while air quality has largely improved in many regions, surface ozone can still be a problem "It means that by just reducing the [nitrogen dioxide] and the particles, you won't solve the ozone problem," explains Guy Brasseur, atmospheric scientist at the Max Planck Institute for Meteorology in Hamburg, Germany, and lead author of the second study.
Concentration of NO2 and O3 in the urban area of Wuhan from 1st January 2020 to 29th February 2020. The red vertical line indicates the day (23rd January) when Chinese authorities implemented the lockdown. The horizontal dash lines show the mean of the represented quantities before and after this date. Credit: Xiaoqin Shi/Guy Brasseur
Comments »
If you enjoyed this article, please consider sharing it:
|