2nd May 2020 First results from NASA's ICESat-2 mission The first results from ice-monitoring satellite ICESat-2 have been published in the journal Science. This data shows that melting in Antarctica and Greenland has contributed 14 mm (0.55 in) of global sea level rise since 2003.
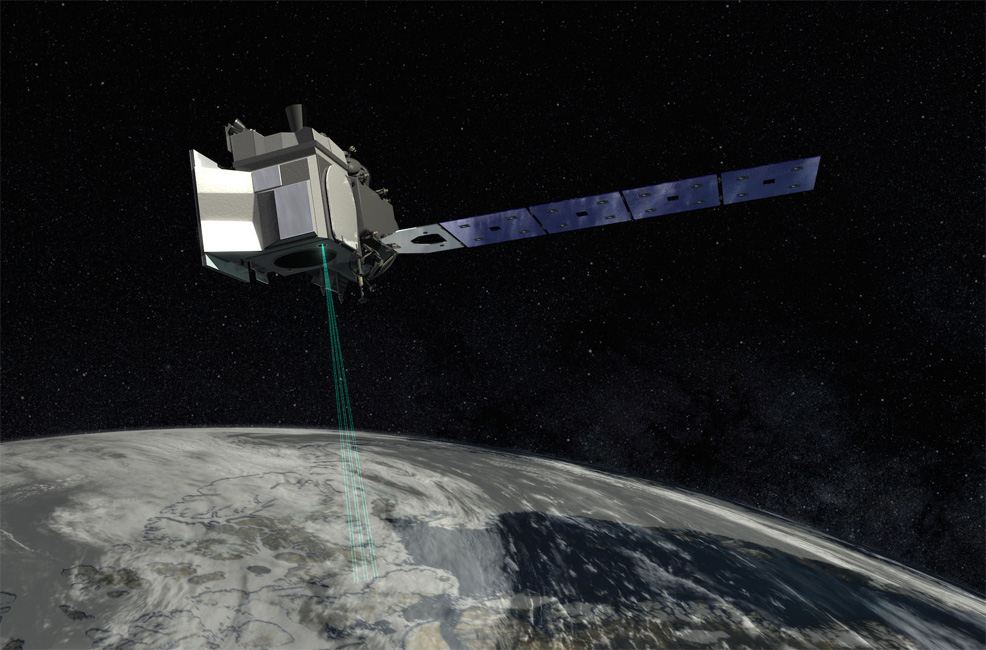
ICESat-2, launched in 2018 as the next-generation successor to ICESat, is the most advanced Earth-observing laser instrument ever deployed in orbit by NASA. The satellite's Advanced Topographic Laser Altimeter System (ATLAS) fires 10,000 pulses per second, precisely timed by onboard mechanisms to determine the round-trip of laser photons as they reflect off the ground and back into space. This provides a data point every 70 cm (28 in) along the satellite's path, which is accurate enough to calculate the annual height change of an entire continent to within 4 mm (0.15 in). For comparison, the previous ICESat fired only 40 pulses a second, taking measurements every 170 m (558 ft). If the two satellites flew over a football field, ICESat would collect data points outside the two end zones, while the ATLAS on ICESat-2 would take measurements within each yard line. This week, a team of scientists led by the University of Washington (UW) published a new study in the journal Science, revealing how Greenland and the Antarctic ice sheets have changed over the last 17 years. From the ultra-precise measurements of ICESat-2, which generated a terabyte of data per day, they find that a combined net loss of ice from these vast regions has caused 14 mm (0.55 in) of global sea level rise since 2003. By comparing the new data with measurements taken by the original ICESat, the UW researchers have generated a comprehensive portrait of the complexities of ice sheet change – and insights into the future.
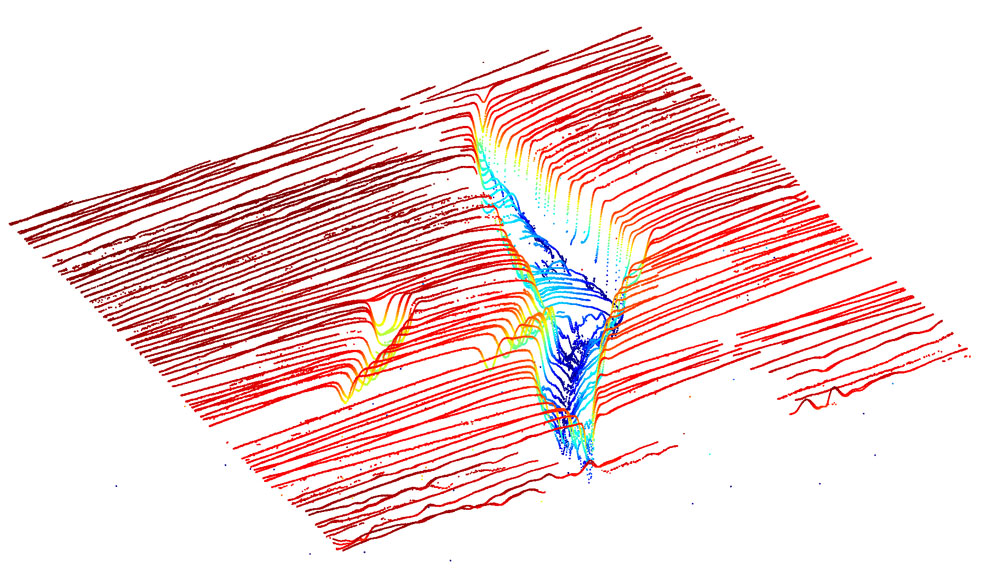
"If you watch a glacier or ice sheet for a month, or a year, you're not going to learn much about what the climate is doing to it," said Benjamin Smith, glaciologist at the UW Applied Physics Lab. "We now have a 16-year span between ICESat and ICESat-2 and can be much more confident that the changes we're seeing in the ice have to do with the long-term changes in the climate. And ICESat-2 is a really remarkable tool for making these measurements. We're seeing high-quality measurements that carpet both ice sheets, which let us make a detailed and precise comparison with the ICESat data." Previous studies of ice loss or gain have analysed data from multiple satellites and aerial surveys. This new study has taken one single type of measurement – height as measured by an instrument that bounces laser pulses off the ice surface – providing the most detailed and accurate picture of ice sheet change to date. The researchers took tracks of ICESat measurements and overlaid the denser tracks of ICESat-2 measurements. Where the two data sets intersected – tens of millions of sites – they ran the data through algorithms that accounted for snow density and other factors, and then calculated the mass of ice lost or gained. The results showed that Greenland's ice sheet lost an average of 200 gigatons of ice per year, while Antarctica's ice sheet lost an average of 118 gigatons of ice per year. One gigaton of ice is enough to fill 400,000 Olympic-sized swimming pools. To visualise this scale: the volume being lost each year is equivalent to a block of ice reaching 5,390 metres high (about 10 times taller than the World Trade Center) and covering the whole of Manhattan Island. Furthermore, this does not include meltwater from land-based glaciers around other parts of the globe, which could roughly triple the 318 gigatons of Antarctica and Greenland.
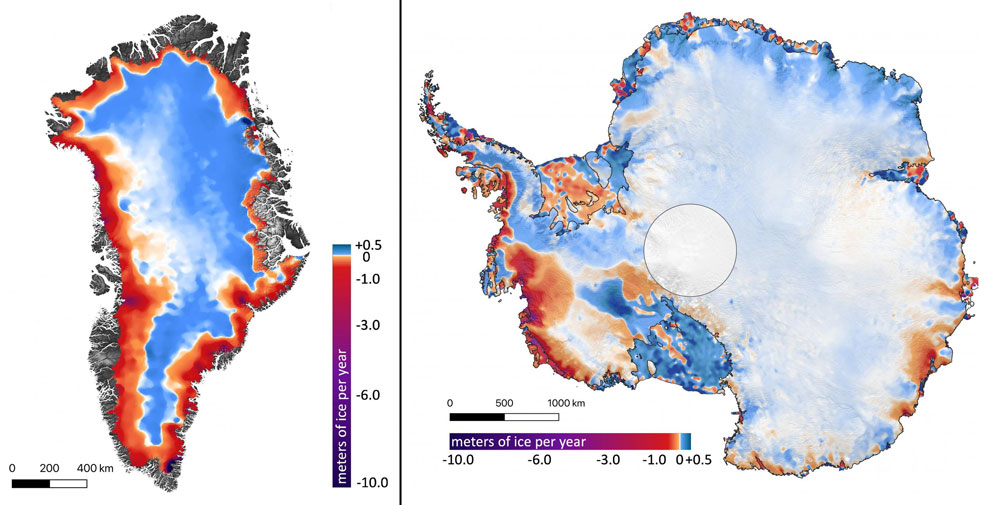
In Greenland, coastal glaciers have thinned significantly. The Kangerlussuaq and Jakobshavn glaciers, for example, have lost between 4 and 6 m (13.1 to 19.7 ft) of elevation per year. Warmer summer temperatures have melted ice from the surface of the glaciers and ice sheets, and in some places warmer ocean water erodes away the ice at their fronts. In Antarctica, the ice sheet is getting thicker in parts of the continent's interior; an argument frequently put forward by climate change sceptics. However, increased temperatures from global warming bring more moisture in the air, creating better conditions for snow falling over Antarctica. In any case, the loss of ice from around the continent's edges – especially in West Antarctica and the Antarctic Peninsula – far outweighs any gains in the interior. The warmer ocean is a contributory factor. Ice shelves help to hold back the flow of glaciers into the ocean, which adds to sea level rise as the land-based ice slips and melts into the water. Melting ice shelves alone do not raise sea levels, since they are already floating – just like an ice cube in a full cup of water does not overflow the glass. However, they do provide stability for the glaciers and ice sheets behind them.
Ice gained or lost by Antarctica from 2003 to 2019. Credit: Smith et al./Science. The circle in the middle is over the South Pole, where the instrument does not collect data.
"It's like an architectural buttress that holds up a cathedral," explains co-author Helen Amanda Fricker, a glaciologist at Scripps Institution of Oceanography at the University of California, San Diego. "The ice shelves hold the ice sheet up. If you take away the ice shelves, or even if you thin them, you're reducing that buttressing force, so the grounded ice can flow faster." These ice shelves, which rise and fall with the tides, can be difficult to measure, said Fricker. Some have rough surfaces, with crevasses and ridges, but the precision and high resolution of ICESat-2 allows researchers to measure overall changes, without worrying about these features skewing the results. Thwaites and Crosson ice shelves have thinned the most, by an average of about 5 m (16 ft) and 3 m (10 ft) of ice per year, respectively. "It was amazing to see how good the ICESat-2 data looked, right out of the gate," said co-author Tom Neumann at NASA's Goddard Space Flight Center in Greenbelt, Maryland. "These first results looking at land ice confirm the consensus from other research groups, but they also let us look at the details of change in individual glaciers and ice shelves at the same time."
Comments »
If you enjoyed this article, please consider sharing it:
|