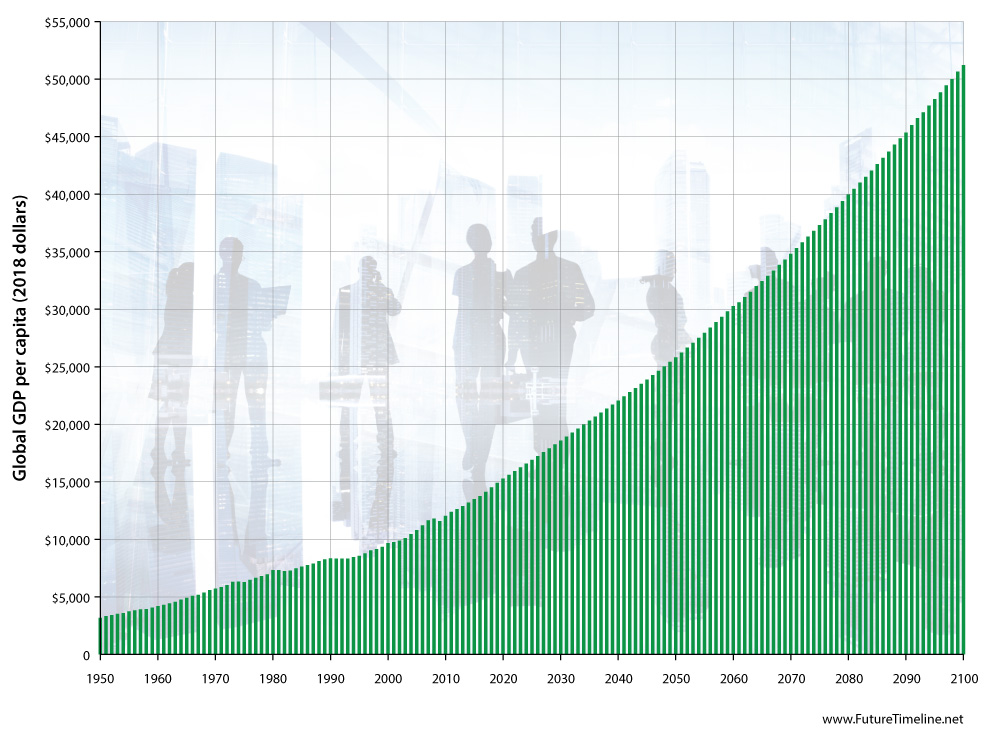
World GDP per capita, 1950-2100 This graph shows the world's GDP per capita, adjusted for inflation, from 1950 until the year 2100. This is calculated by dividing the global GDP by the total number of people living in the world. The current (as of 2018) GDP per capita is approximately $14,500. It is projected to reach almost $26,000 by 2050 and may exceed $50,000 by 2100. However, these figures are simply based on current trends. They take no account of potential disruptive events, such as the impacts of job automation and technological unemployment, cryptocurrencies, climate breakdown, etc. It is also unclear as to whether our current model of economic growth is sustainable on a planet with finite resources. The graph is therefore left open to readers' interpretations.
Sources: Gross World Product, 1950-2011, Earth Policy Institute: International Macroeconomic Data Set, United States Department of Agriculture: GDP long-term forecast (World), OECD: World Population Prospects 2017 – Total Population: Median and prediction intervals, United Nations: CPI Inflation Calculator, U.S. Bureau of Labor Statistics:
Posted: 31st December 2018. Last updated: 31st December 2018.
If you enjoy our content, please consider sharing it:
|