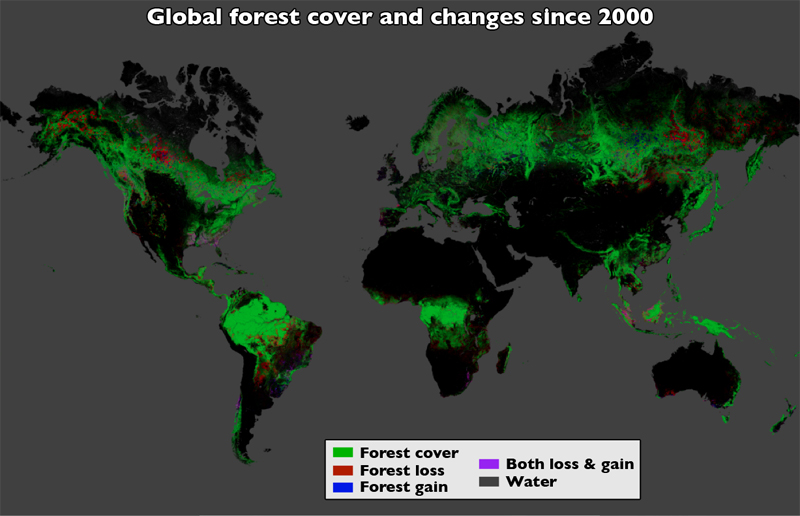
18th November 2013 The most detailed ever map of global deforestation Using a vast database of high-resolution satellite imagery, researchers at the University of Maryland have produced the most detailed ever map of forest loss and gain between 2000 and 2012. This has been made freely available on Google Earth.
A total of 654,000 cloud-free images were obtained from Landsat 7 – an orbiting satellite managed and operated by the U.S. Geological Survey. Each of the 143 billion pixels on the map shows an area roughly 30 metres square and provided researchers with enough detail to determine if an area had lost or gained tree cover. It was estimated that 888,000 sq mi (2.3 million sq km) of forest were lost, while around 309,000 sq mi (0.8 million sq km) regrew, a net loss of 579,000 sq mi (1.5 million sq km). This resulted from a combination of logging, wildfires, windstorms and insect pests. Key to the project was collaboration with team members from Google Earth Engine, who reproduced in the Google Cloud the models developed at the University of Maryland for processing and characterising Landsat data. Prior to this study, country-to-country comparisons of forestry data were not possible at this level of accuracy. Different countries define forests differently, making previous global comparisons difficult with existing inventories. Professor of Geographical Sciences, Matthew Hansen, who led the study: "When you put together datasets that employ different methods and definitions, it's hard to synthesise. But with Landsat, as a polar-orbiting instrument that takes the same quality pictures everywhere, we can apply the same algorithm to forests in the Amazon, in the Congo, in Indonesia, and so on. It's a huge improvement in our global monitoring capabilities." "Losses or gains in forest cover shape many important aspects of an ecosystem – including climate regulation, carbon storage, biodiversity and water supplies, but until now there has not been a way to get detailed, accurate, satellite-based and readily available data on forest cover change from local to global scales."
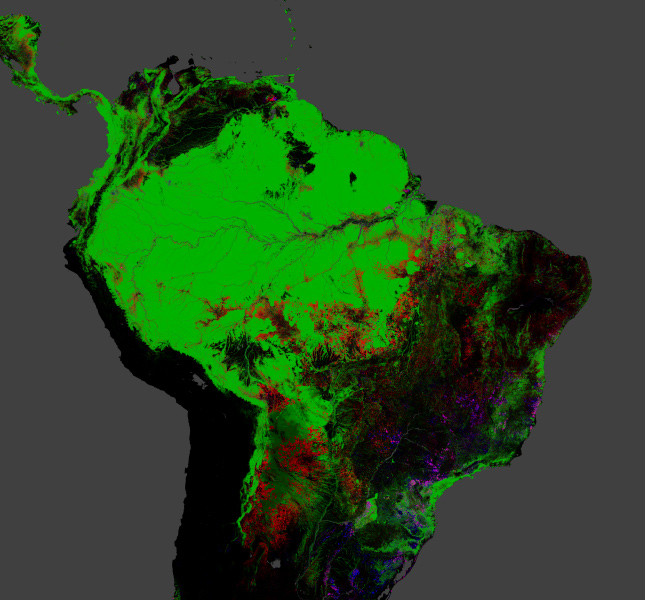
Jeff Masek, Landsat project scientist at NASA: "Since the first Landsat satellite launched 41 years ago, scientists have been improving their land cover analysis as computers have become more powerful. Projects like Hansen's took a big leap forward once USGS made the data freely available on the Internet in 2008." "This is the first time somebody has been able to do a wall-to-wall, global Landsat analysis of all the world's forests – where they're being cleared, where they're regrowing, and where they're subject to natural disturbances," he added, noting that the maps could be routinely updated to help in carbon accounting and other studies of land cover change. Subtropical forests were found to have the highest rates of change, largely due to intensive forestry land uses. The rate of disturbance for North American subtropical forests, located in the Southeast United States, was found to be four times that of South American rainforests. More than 31 percent of U.S. southeastern forest cover was either lost or regrown. Landowners in this area harvest trees for timber and quickly plant replacements, treating them like crops, which makes it a highly intensive region for tree loss and gain. Brazil's recent efforts to reduce its deforestation were offset by increasing forest loss in other tropical regions including Angola, Bolivia, Indonesia, Malaysia, Paraguay and Zambia. The country with the largest relative increase in forest loss was Indonesia, more than doubling its annual figure to almost 20,000 sq km (7,722 sq mi). Other countries with high rates of deforestation included Russia and Canada. To view the forest cover maps in Google Earth Engine, visit the following link: http://earthenginepartners.appspot.com/google.com/science-2013-global-forest An even more detailed study – the BIOMASS mission – is planned for 2019. This observatory will be powerful enough to determine the height and wood content of individual trees.
Comments »
|