13th May 2024 Record-high growth in atmospheric CO2 A record annual increase in atmospheric CO2 is reported from the Mauna Loa Observatory in Hawaii, with a jump of 4.7 parts per million (ppm) compared to a year earlier.
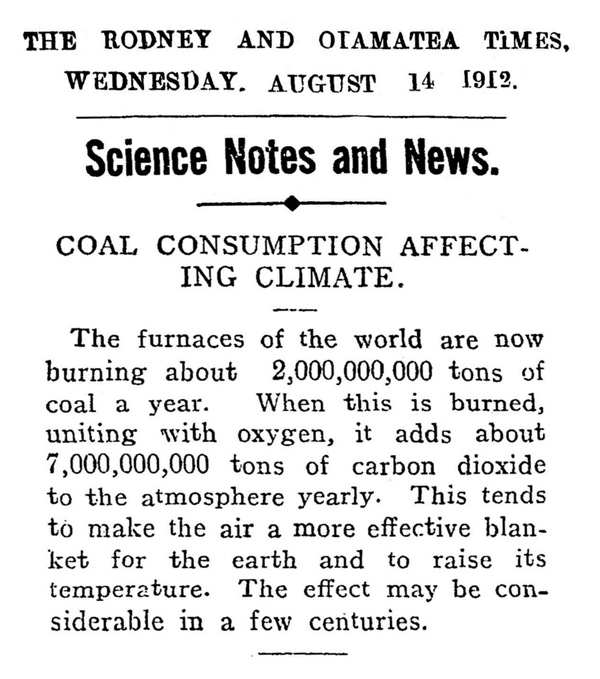
The basic physical mechanisms of greenhouse gases have been known since the 19th century. In 1824, French mathematician and physicist Joseph Fourier calculated that given its distance from the Sun, the Earth should be colder by as much as 33 °C (59.4 °F). In 1859, Irish physicist John Tyndall demonstrated that some gases – including carbon dioxide (CO2) – block infrared radiation. He showed that even in small quantities, these gases absorb heat much more strongly than the atmosphere itself, thus proving the link between greenhouse gases and temperature. In 1896, a Swedish scientist called Svante Arrhenius further quantified this effect, becoming the first to calculate how changes in CO2 levels could alter the surface temperature of the Earth. The International Meteorological Organisation (IMO) began to compile and standardise global weather data, including temperature. It would later become the World Meteorological Organisation (WMO) that we know today. Building on the earlier work of Fourier, Tyndall, and Arrhenius, numerous other scientists modelled CO2 during the early 20th century. In 1912, the potential for human activity to influence temperature on a global scale began to attract media attention, as coal use reached two billion tons annually. A newspaper based in New Zealand warned of "a more effective blanket for the earth" resulting from the seven billion tons of CO2 emissions, the effect of which "may be considerable in a few centuries".
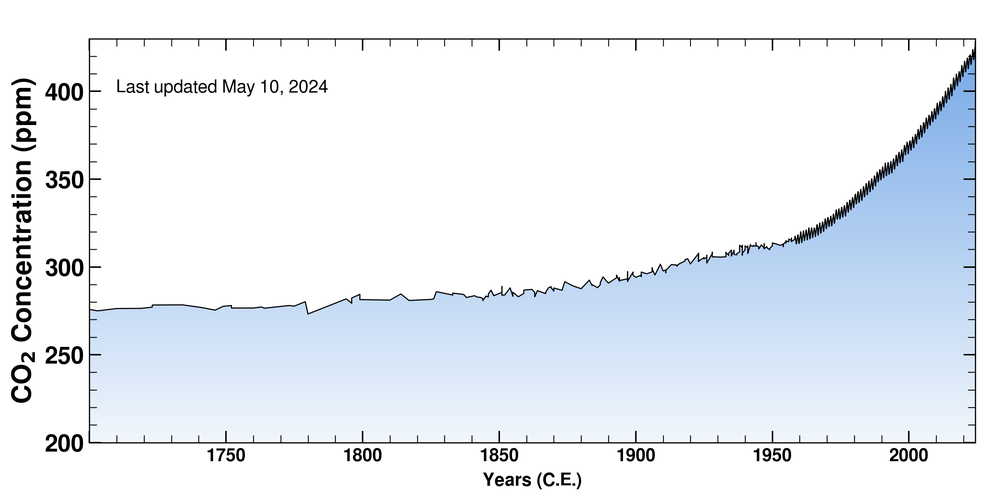
In 1956, Canadian physicist Gilbert Plass published his seminal paper, "The Carbon Dioxide Theory of Climatic Change", in the journal Tellus. He predicted that global atmospheric CO2 in the year 2000 would be 30% higher than in 1900, that the planet would be 1 °C (1.8 °F) warmer in 2000 than in 1900, and that a doubling of the CO2 level would warm the planet by 3.6 °C (6.5 °F). Overall, these forecasts proved to be impressively prescient, given the limited data and computational tools available at the time. By 2000, the CO2 level had increased by 25%, while emissions of CO2 and other greenhouse gases contributed to warming of 1.02 °C from 1900 to 2000. That is without accounting for the cooling effects of sulphur dioxide and aerosols, which global climate models only began to include in the 1990s. As for his third prediction, current estimates from the IPCC and recent models suggest that climate sensitivity – i.e. the temperature increase from a doubling of CO2 – is likely between 1.5 °C and 4.5 °C, with a best estimate of about 3 °C. In June 1956, a month after publication of Plass' study, another prominent scientist named Charles Keeling helped to establish the Mauna Loa Observatory at a high-altitude site in Hawaii, to continuously monitor atmospheric changes. Within two years, he developed a data set known as the Keeling Curve, which remains a crucial tool in climate science to this day. The Keeling Curve, one of the most important scientific works of the 20th century, provides a truly clear picture of Earth's atmospheric CO2 level in parts per million (ppm). Combined with pre-1958 measurements, it shows a rapid rise in atmospheric CO2 that correlates with human industrial expansion. The first measurement at Mauna Loa, taken in March 1958, recorded an atmospheric CO2 concentration of 313 ppm. Scientists at the observatory soon noted a seasonal cycle, seen as peaks and dips every few months, caused by changes in land vegetation. But measured over years and decades, the CO2 level showed a clear upward trend.
Fast forward to more recent times. The Keeling Curve passed an ominous milestone in 2013, reaching 400 ppm for the first time. Today, it continues to rise and now stands at 427 ppm. Many other monitoring stations have been established around the globe, all confirming the same trend. Moreover, the increase is becoming more rapid over time. Back in the mid-20th century, yearly increases tended to hover around 1 ppm. By the first decade of the 21st century, this had increased to 2 ppm. Annual growth rates have begun to average 2.5 ppm in the 2020s. The previous record for a year-over-year change stood at +4.1 ppm in June 2016. However, an even bigger jump is now reported. The latest reading from the Mauna Loa Observatory confirms that between March 2023 and March 2024, Earth's atmospheric CO2 increased by +4.7 ppm. This data is available from the Scripps CO2 program, which maintains the iconic record at Mauna Loa and other sites. So, where is all this CO2 coming from? We know, because of isotopes, which are variants of chemical elements that differ in neutron number. The isotopes of naturally emitted CO2 and fossil fuel-derived CO2 are different, meaning that scientists can tell what proportion of the increase is due to sources like volcanoes and how much is due to human activity. The overwhelming consensus in the scientific community – supported by virtually every national and international science agency – indicates that the increase in CO2 levels, particularly the rapid rise observed over the past few decades, is primarily due to human actions rather than natural variations in the carbon cycle. Now, for those who are skeptical about the impacts, a rise of 4.7 ppm may seem rather trivial. We are talking about parts per million, after all. However, even a "small" numerical change can soon become significant when altering the vast volume of Earth's atmosphere, occurring on a regular basis and within the geological blink of an eye. During the transition from the last ice age to the current interglacial period, CO2 levels increased by about 80-100 ppm over roughly 5,000 to 8,000 years. This equates to about 0.01 to 0.02 ppm per year – vastly slower than current observed rates. A recent survey of climate scientists, published by The Guardian, found that 77% of respondents expect global warming to reach at least 2.5 °C (4.5 °F) by the year 2100, with almost half predicting at least 3 °C (5.4 °F). This would be catastrophic for much of the world. For instance, each additional 0.1°C rise will place another 140 million people at risk of extreme heat. While humanity's long-term outlook may appear bleak, there is reason for hope. We live in an era of rapid technological change. Many developed countries have already peaked their emissions and decoupled economic growth from carbon, even when taking offshored production into account. The clean tech revolution is in full swing, with solar and wind power undergoing astonishing growth, along with battery storage, EVs, and other innovations. But even greater efforts will be needed to stay within internationally agreed targets and prevent climate tipping points. "The rate of rise will almost certainly come down, but it is still rising – and in order to stabilise the climate, you need CO2 level to be falling," said Ralph Keeling, director of the Scripps CO2 program and son of the late Charles Keeling, who passed away in 2005. "Clearly, that isn't happening. Human activity has caused CO2 to rocket upwards. It makes me sad more than anything. It's sad what we are doing."
Comments »
If you enjoyed this article, please consider sharing it:
|