Data & trends
22nd February 2019
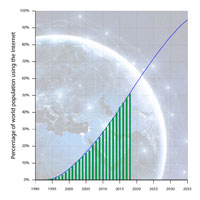
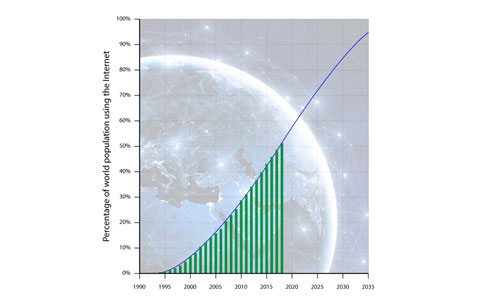
World population using the Internet, 1990-2035
This graph shows the percentage of the world's population using the Internet from 1990 to 2018, with a future trend line projected to 2035.
Read more...
7th February 2019
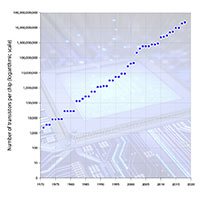
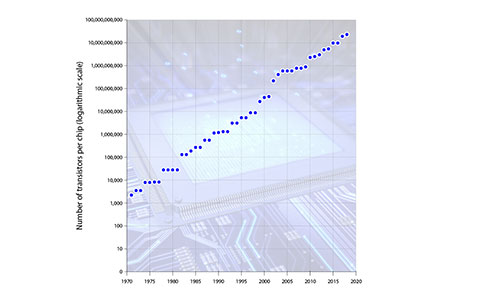
Moore's Law, 1970-2100
These two graphs illustrate the exponential growth in chip transistor counts, from 1970 until 2100.
31st December 2018
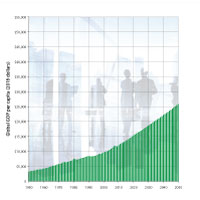
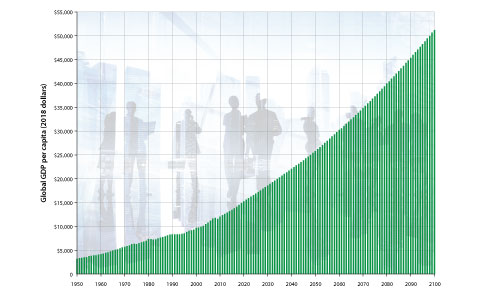
World GDP per capita, 1950-2100
This graph shows the world's GDP per capita, adjusted for inflation, from 1950 until 2100.
11th November 2018
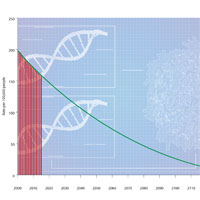
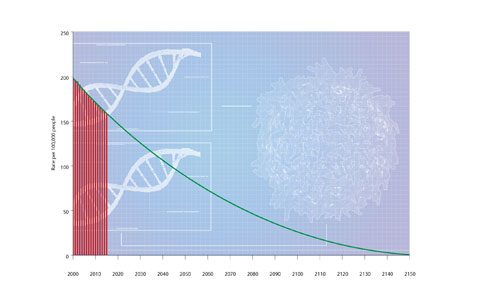
Cancer deaths in the United States, 2000-2150
This graph shows the declining number of deaths from cancer in the United States (rate per 100,000 people) from 2000 until the year 2150.
1st September 2018
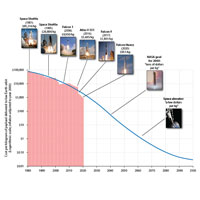
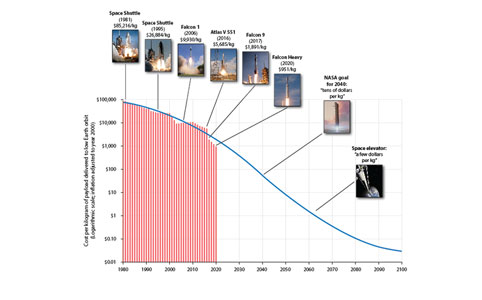
Launch costs to low Earth orbit, 1980-2100
This graph shows the declining costs of launching people and cargo into space.
8th July 2018
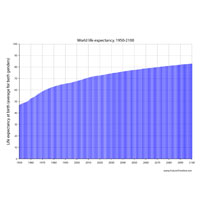
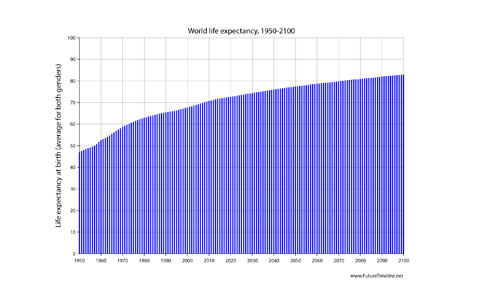
World life expectancy, 1950-2100
This graph shows worldwide life expectancy at birth, averaged for both genders and all nations, from 1950 to 2100 under a UN "medium" variant scenario.
28th February 2018
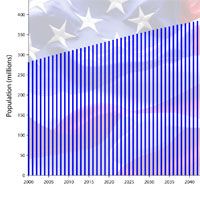
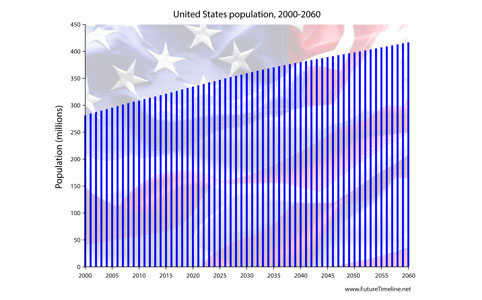
United States population, 2000-2060
This graph shows past, present and estimated future numbers of people in the United States from 2000 to 2060.
18th December 2017
Personal service robot population, 2000-2050
This graph shows past, present and estimated future numbers of personal service robots operational around the world.
7th December 2017
Industrial robot population, 1990-2040
Past, present and estimated future numbers of industrial robots installed globally.
26th June 2017
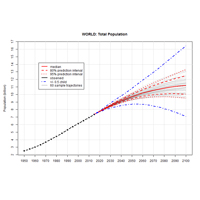
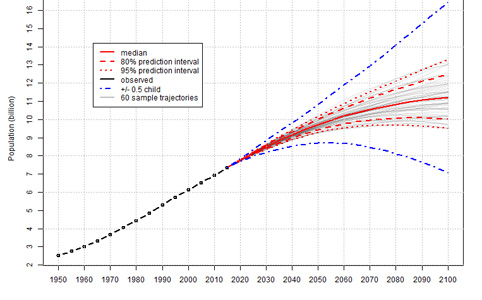
Global population
Future predictions of global population from the United Nations.
Next »