|
|
 |
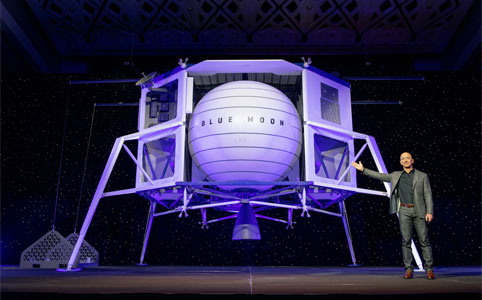
13th May 2019
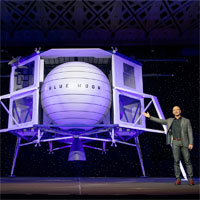
Going to space to benefit Earth
At a presentation event in Washington, D.C., Jeff Bezos unveiled a new lunar lander developed by his space company, Blue Origin. He outlined his vision of an "incredible civilisation" with trillions of people living in space.
Watch video... |
|
|
 |
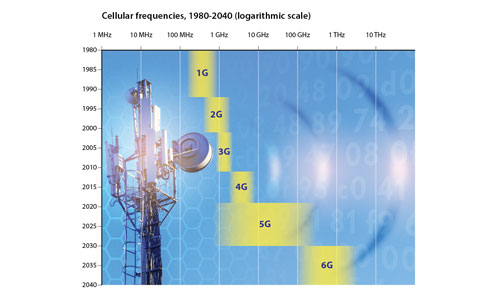
30th March 2019
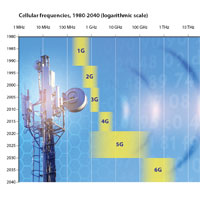
Cellular frequencies, 1980-2040
This graph shows the progress in mobile cellular frequency ranges, from the first generation in the 1980s to the sixth generation that is predicted for the 2030s.
Read more... |
|
|