
![[+]](https://www.futuretimeline.net/images/buttons/expand-symbol.gif)
|
|
|
|
|
|
2050
Net zero progress has been mixed
By 2050, global emissions of carbon dioxide (CO2) from human activity have declined significantly* – a historic turning point after nearly three centuries of industrial expansion marked by a seemingly never-ending rise in atmospheric pollution.
Most of the reductions have come from a transition to cleaner forms of electric generation. Solar power surpassed many analysts' forecasts by undergoing exponential growth in capacity. Onshore and offshore wind projects have also played major roles, with hydropower, geothermal, and other renewables contributing a smaller amount. Nuclear power is still widespread but declining in popularity due to its high costs and long build times. In 2050, only about 30% of the world's electricity is still generated by the burning of fossil fuels, a figure that will reach zero by the 2070s.
Batteries, both at utility scale and for individual homes and businesses, have solved most of the baseload and intermittency issues of the past. These and other storage solutions now ensure a cheap and reliable supply from solar and wind, even during periods of low generation. Energy conservation measures and improved efficiencies have played crucial roles in reducing overall demand, from the widespread adoption of smart grids and appliances to advanced building materials and urban planning initiatives.
Electric vehicles (EVs) are now dominating the world's roads. Sales of new cars, trucks, and buses with internal combustion engines (ICEs) are now banned by practically all major developed countries, with even most emerging economies in the process of phasing these vehicles out.
Aviation and cargo shipping are undergoing similar transitions. Air travel has seen a shift toward electric and hydrogen power, particularly for short-haul flights, while biofuels and synthetic fuels are often used for long-haul routes. Advanced air traffic management and AI-optimised flight paths have further cut emissions. Cargo ships, once massive polluters, are increasingly powered by clean fuels, with electric engines and wind-assisted propulsion becoming far more common.
Heavy industries such as steelmaking, manufacturing, and chemical production are also experiencing a transformation. In steelmaking, the reliance on coal is diminishing rapidly with a shift towards hydrogen-based processes and electric arc furnaces. Manufacturing and chemical production are incorporating more renewable energy sources and electrification in their processes. Innovations in carbon capture, utilisation, and storage (CCUS) technologies are helping to mitigate emissions from these sectors.
During the early 21st century, worldwide carbon emissions had skyrocketed, in particular due to the rapid emergence of China. By 2006, its annual CO2 output had overtaken that of the United States. The emerging superpower seemed to be building a new coal-fired power plant every week. News media and scientific journals presented a regular barrage of reports and data showing record high emissions and the consequent impacts on the environment, triggering a sense of doom and hopelessness for many people, and outright denial from others.
But as international concern over climate change intensified, China began to dramatically shift away from fossil fuels and towards the clean energy technologies of the future. Unlike the hyper-partisan United States, its government accepted the science and the urgent need for action. This stance, combined with its authoritarian regime, made it easier for low and zero carbon technologies to take root and grow rapidly.
From being the single largest cause of global warming, China would soon become a global leader on the issue. By 2020, the country's wind and solar capacity had reached 536 gigawatts (GW) – more than the European Union and the United States combined* – and by 2023, its annual rate of clean energy installations exceeded the entire G7 by more than four times.*
China's future targets included peaking its carbon emissions by 2030 and a longer-term ambition of carbon neutrality by 2060. The astonishingly rapid rollout of solar, wind, electric vehicles (EVs), and other technologies allowed China to meet the first of these goals earlier than expected.* This led to a worldwide peak in carbon emissions during the mid-2020s,**** a crucial turning point in the fight against climate change.
Despite these many efforts, the world has failed to limit the rise of global warming by 2050. Although major improvements have occurred, even faster deployments of clean technology had been required to keep the growth of CO2 to a safe level.** Temperatures have recently passed the critical threshold of 2 °C (3.6 °F) above the pre-industrial average and are now on track to reach 2.5 °C (4.5 °F) or higher by 2100.*

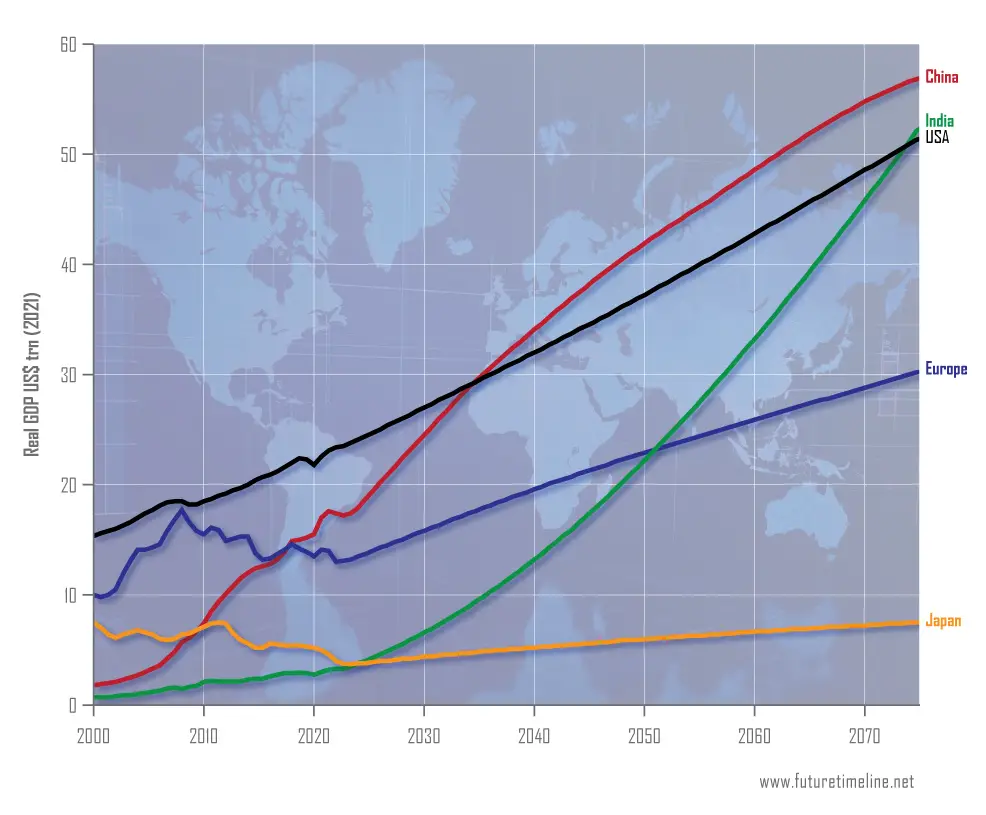
Economic power has shifted from West to East
By 2050, the global economic landscape has undergone a transformative shift, the balance of power moving decidedly in favour of the East. The emergence of China and India has been accompanied by the broader ascendancy of Asian markets. These neighbouring countries have successfully addressed a range of social and demographic challenges – adapting their vast human resources to a world of increasingly rapid technological change, while using their strategic economic policies to outpace the traditionally dominant Western economies.
The United States, despite its continued prominence, now shares the limelight with these Asian giants, each harnessing their own set of advantages. India has capitalised on its demographic dividend, with a young population of skilled workers and innovators fuelling economic growth through domestic consumption and increased savings. China, faced with challenges including an aging population and shrinking workforce, has navigated through these issues via adaptations that include heavy investments in automation, artificial intelligence, infrastructure, and other technologies to enhance productivity, alongside policy reforms aimed at managing demographic shifts. Ongoing adaptability and societal acceptance of these changes have been critical factors for the country's success.
Europe and Japan, meanwhile, have faced slower growth rates, primarily due to their aging populations and the challenges of maintaining momentum in innovation and workforce development. Unlike China – with its more decisive and authoritarian government – these regions took a more incremental approach to policies needed for the mid-21st century. This lack of agility is now hindering their ability to maintain a competitive edge on the global stage.
Large-scale investment and infrastructure megaprojects – such as the Belt and Road Initiative – have expanded China's influence across Africa and Eurasia – weaving a network of economic dependencies and partnerships that have reshaped global trade routes and capital flows. With its focus on digital infrastructure, India has further solidified its reputation as a leading hub for software and services.
South Korea has strengthened its position as the leading chip maker, following the recent completion of a mega chip cluster. Indonesia's gross domestic product (GDP) has seen a six-fold expansion, from US$1.1trn in 2020 to US$6.3trn by 2050, overtaking the likes of Germany, Japan, and the United Kingdom to reach fourth place in the global rankings. Similarly, the Philippines has grown from US$0.4trn in 2020 to US$2.5trn by 2050.
The economic reorientation towards the East has occurred in parallel with major social and cultural shifts. Asian trends and innovations are increasingly setting the pace in global fashion, entertainment, and lifestyle. The world's attention is now as likely to be captivated by Bollywood and K-cinema as by Hollywood, symbolising a broader acceptance and integration of Eastern culture into the global mainstream.
In the wake of unprecedented job automation and technological disruption, governments and societies have been compelled to reimagine the structure of work and wealth distribution. Universal basic income (UBI) – not a new idea – has seen widespread implementation by 2050, providing a regular and unconditional sum of money to every citizen, both to stimulate the economy and to ensure a standard of living above the poverty line regardless of employment status.
Some countries have been able to introduce the initiative more easily than others. This includes those with strong social welfare systems already in place and a history of progressive policies, such as parts of Northern and Western Europe, Canada, Australia, and New Zealand. By contrast, UBI has faced an uphill battle in some of the more traditionally capitalist societies, such as the United States, with its emphasis on individualism and scepticism toward welfare programs.
UBI is funded in numerous ways, which are subject to ongoing debate and refinement in 2050. A new taxation system on companies that benefit the most from advancements in AI is among the most popular measures.
Other forces have reshaped the global economy. The integration of blockchain technology and cryptocurrencies has gained far greater mainstream acceptance for both everyday transactions and as a store of value. This has diminished the dominance of traditional banking systems and fiat currencies, enabling more direct peer‑to‑peer transactions and reducing reliance on intermediaries. These decentralised technologies have created more efficient supply chains, enhanced security in digital identities, and immutable records for transparent governance. Having been valued at several billion dollars in the early 2020s, blockchain has grown to reach a multi-trillion-dollar market size by 2050.
Meanwhile, a dramatic shift away from the fossil fuel economy – thanks to exponential improvements in the cost and capacity of renewables – has reduced the volatility of energy prices. Cheap and abundant clean energy, near-ubiquitous electrification of transport, and greener industrial processes (such as "green steel" and bioplastics) are now common around the world. Although climate change is having many impacts, the economic costs are being offset to a certain extent by improved air quality and its resultant lowering of the burden on public health. China remains on track to reach net zero by the early 2060s and India by 2070.
Despite the emergence of these Asian powerhouses, overall global GDP growth has slowed – from an average of 3.6% per year in the 2000s, to 3.2% per year in the 2010s, to 2.8% in the 2020s, and only around 2% by the 2050s. This is due in large part to falling birth rates. It will become a much more significant issue during the second half of the century as the world's population begins to plateau.
Globalisation has reduced the level of income inequality between countries, creating a more level playing field for the world. However, inequality has increased within individual countries.* The extreme concentration of wealth and income by a handful of individuals is made all the more obvious by the arrival of several trillionaires.
Another trend becoming more noticeable by 2050 is a decline in the percentage of global GDP from "free" and "mostly free" economies. This has fallen from around 66% in 1990, to 45% by 2020 and just 26% by 2050.* Increased state intervention in economic systems is a defining feature of the global economy during this period. The rise of China, with its unique blend of state-led capitalism, has been a significant contributing factor in this shift.
The Amazon rainforest has lost 30% of its original tree cover
The Amazon Basin, spanning nine countries and encompassing 35% of South America, is Earth's most vital ecosystem – home to 10% of all known species and playing a key role in climate regulation through its vast carbon stores and weather-influencing moisture cycles. Yet by this year, centuries of deforestation and degradation have reduced its forested area to only about 5.3 million square kilometres.* That's a loss of 30% from the pre-industrial total of 7.6 million km².
Since the 1980s, satellite observations have charted the forest's gradual but relentless contraction. Logging, farming, cattle ranching, mining, fires, and roadbuilding have steadily eaten away at the dense green canopy. Following heavy losses in tree cover during the early 2000s, and again in the early 2020s, moderate conservation efforts and policy shifts have succeeded in avoiding the worst-case scenarios by 2050. Nevertheless, the Amazon today is a deeply fragmented landscape. The remaining forest is now increasingly split into disconnected patches, some severely degraded. Large swathes of the eastern and southern portions have shifted toward drier, more savanna-like ecosystems. As a result, many species that once thrived in the dense, humid rainforest are now endangered or extinct in the wild.
The Amazon's degradation has been driven by a combination of land-use pressures, climate change, and political inertia. Significant areas of forest continue to be cleared for agriculture, resource extraction, and new transport infrastructure. Protected zones and Indigenous territories face ongoing, illegal incursions. Enforcement remains patchy in some regions, with intermittent spikes in forest loss – particularly during election cycles, when candidates often relax environmental regulations to court commercial interests, or delay action amid political uncertainty and shifting priorities.
Climate change has exacerbated the problem, increasing the risk of severe droughts and mega-fires that further undermine the forest's stability. The cumulative loss of 2.3 million km² of forest since pre-industrial times has triggered non-linear feedbacks within the Amazonian climate system.* With fewer trees available to transpire moisture into the atmosphere, rainfall patterns have weakened – particularly in the dry season, which is now both longer and hotter. Large areas of the southeastern Amazon, once among the most humid places on Earth, have become increasingly vulnerable to drought.

During the 2010s, aircraft surveys of the southern and eastern Amazon revealed the early stages of a regional tipping point, as parts of the forest shifted from carbon sink to carbon source.* By 2050, this ominous signal has escalated into a basin-wide transformation, with the entire rainforest now emitting more carbon than it absorbs.*
These changes, driven by drought, fires, decaying biomass, and human-related degradation, have added over ten billion tonnes of CO2 to the atmosphere from Brazil's portion of the rainforest alone.* So-called "flying rivers" – vast aerial streams of Amazonian moisture – once delivered up to half of the rainfall sustaining central and southern Brazil's farmlands. But with fewer trees to recycle water, those atmospheric rivers have weakened, while the dry season is growing ever longer and hotter.* The cascading effects now threaten both the forest's long-term survival and the food security of a continent.
Biodiversity has suffered catastrophic losses. Species that once roamed vast, interconnected territories have been pushed into fragmented pockets of habitat. Jaguars (Panthera onca), for example,* have vanished from much of their historical range in the southern and eastern Amazon. Giant river otters,* harpy eagles, and tapirs have also seen major population declines. Some subspecies now exist only in isolated strongholds or conservation units.
Trees are facing similarly bleak prospects, with around 40–50% of species threatened by 2050.* Once-dominant trees like the Brazil nut (Bertholletia excelsa), mahogany (Swietenia macrophylla), and rubber trees (Hevea brasiliensis) are struggling to regenerate in disturbed zones. Invasive grasses are spreading rapidly in their place, especially after repeated fires.
Satellite monitoring has dramatically improved by 2050, enabling researchers to track deforestation and habitat degradation with extreme precision in real-time. Meanwhile, conservation groups are racing to catalogue the region's biodiversity before it disappears – expanding DNA banks, seed vaults, and arboretums across Brazil, Peru, and Colombia. Assisted migration and selective reforestation projects are also underway, aiming to strengthen ecosystem resilience by introducing fire-tolerant species or helping vulnerable trees recolonise suitable habitats.
While the Amazon has avoided a worst-case scenario by 2050, its trajectory remains deeply concerning. The transition from a stable rainforest system to a degraded, patchy landscape is now alarmingly visible. Although 70% of the original tree cover remains, the continued loss of intact ecosystems is threatening to push the region past irreversible tipping points. The challenge for the second half of the 21st century is not only to halt deforestation, but to restore and reconnect what has already been lost.

Credit: kikkerdirk
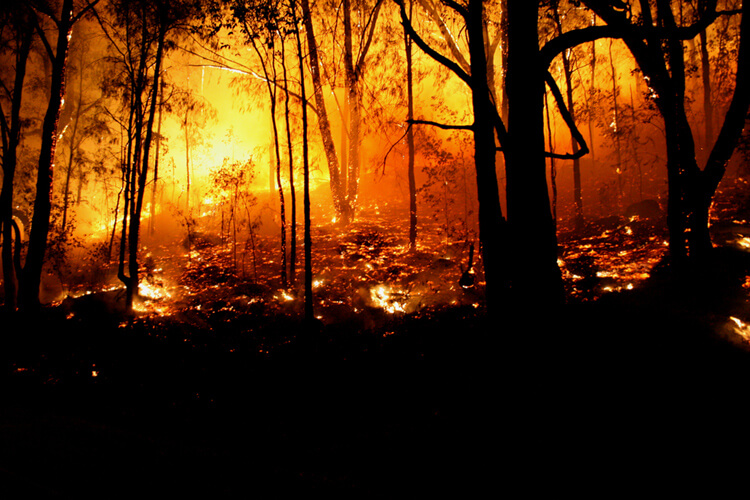
Wildfires have tripled in some regions
Rising global temperatures are creating drier conditions for vegetation – producing larger and more frequent wildfires. In North America, the geographic area typically burned has increased by an average of 50%. Worst hit are the forests of the Pacific Northwest and the Rocky Mountains, which have seen a tripling of areas affected.*
With so much extra burning, air quality and visibility in the western United States is being significantly altered. There has been a 40% rise in organic carbon aerosols and other smoke particles. These irritate the lungs, but are especially dangerous to people who have trouble breathing as a result of asthma and other chronic conditions. Southern Europe is also badly affected – especially Greece, which has been ravaged in recent decades.*
These wildfires are triggering positive feedback loops. As more and more carbon is liberated from burning material and released into the atmosphere, this is further accelerating the pace of global warming.
Traditional wine industries have been severely altered by climate change
By 2050, many of the world's most famous wine-producing areas have been rendered unsuitable for traditional grape growing and winemaking, with climate change having severely impacted land use, agricultural production and species ranges. The area suitable for wine production has declined by almost 85 per cent in some regions. California, Mexico, the eastern USA, Southern Europe, South Africa and Australia are particularly affected.**
In response to the crisis, many traditional vineyards have shifted to higher elevations with cooler conditions – putting pressure on upland ecosystems, as water and vegetation are converted for human use. Others have made use of genetic engineering, or indoor growing methods such as vertical farming. Geoengineering efforts are also getting underway, but have yet to be successful on a global basis.*
Although many regions have been devastated, others have actually benefited. This is particularly noticeable in the Rocky Mountains near the Canadian-US border, the westernmost parts of Russia, and Europe which has seen a massive shift northward in the areas suitable.
Click to view larger version
Credit: Conservation International
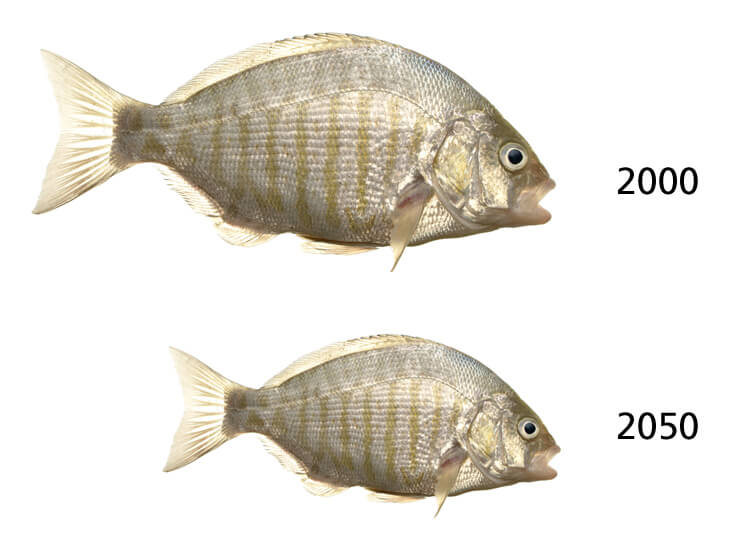
Fish body size has declined by nearly a quarter
By far the greatest impact from global warming has been in the seas and oceans,* where changes in heat content, oxygen levels and other biogeochemical properties have devastated marine ecosystems. Globally, the average body size of fish has declined by up to 24 per cent compared with 2000.* About half of this shrinkage has come from changes in distribution and abundance, the remainder from changes in physiology. The tropics have been the worst affected regions.
Hi-tech, intelligent buildings are revolutionising the urban landscape
In the first half of the 21st century, a soaring urban population posed serious problems for the environment, health and infrastructure of many cities. In newly industrialised nations especially, urban centres became polluted, overcrowded and chronically inefficient. Throughout the world, metropolitan areas grew to unprecedented sizes – putting huge and increasing pressure on city planners to adapt.*
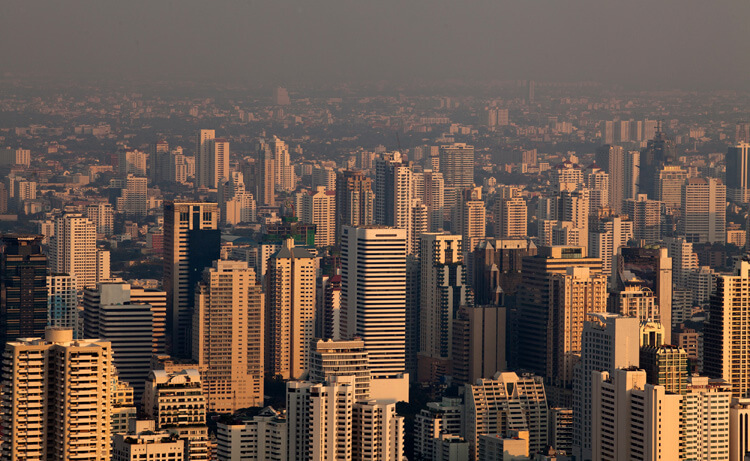
Amid worsening climate change and resource depletion, urban regions were forced to either evolve, or die off. Countless cities failed to make this transition in time, and went the way of Detroit, many being abandoned and left to decay, or subject to intense military control and martial law. In those that survived, a new generation of buildings and infrastructure emerged based on these rapidly changing social and environmental needs.*
Among the most important trends in modern architecture has been self-sufficiency. By 2050, environmental and resource degradation have become so obvious and huge, it has triggered a radical rethink of production and consumption by citizens. As such, many modern skyscrapers now come complete with the internalised creation of food, water and other resources. Farms often comprise multiple floors of a tower – regardless of its purpose – while rain, mist and condensation are constantly trapped and stored. Advanced 3D printers are available locally on site to manufacture everything from household furniture, to personal transportation, to replacement parts for the building itself. Energy is typically provided by photovoltaics and wind turbines. These are often integrated seamlessly into the building design, so as not to harm the aesthetic appeal. Solar power, for instance, can be collected by window panes or special photovoltaic paints applied to outside surfaces.* The efficiencies for solar have been improving steadily for decades.*
Nature features heavily in these structures. Many towers incorporate parks and sky gardens, helping to increase the overall biodiversity of a city, with numerous bird and small animal species finding homes and nesting places. Careful environmental controls ensure that these creatures are protected while not becoming a nuisance for human residents. The outside of buildings are often covered with vegetation, or special membranes, designed to filter pollutants and capture CO2.* Government regulations now require a large percentage of buildings to be fitted in this way, making it a dominant style of architecture today. The artificial parts of this outer layer can also adjust to wind conditions, temperatures, moisture levels and sunlight in order to produce optimal thermal comfort for the human and animal occupants. Algae bio-fuel cells adorning the facade can also absorb CO2 while acting as an additional source of electricity.*

Buildings are integrated into the city around them in a number of ways. Fuel restrictions and other factors have led to increasingly socialised transportation. The bottom floors of most towers have dedicated public car share (AI controlled) and bike share facilities, while bus and other mass transit stations are often built into the structures themselves. Pedestrian sky-walkways feature heavily in most modern cities, improving access and permeability of the urban realm, while shielding walkers from the elements. If ornamented with foliage, they can also function as elevated parks and gardens.
Buildings are making cities more comfortable and inviting in various other ways. By tightly controlling a tower's reflectivity, heat absorption and heat balance, for example, planners can significantly reduce the temperatures associated with urban heat island effects. This comes at a time when temperatures in less developed cities are soaring from the combined effects of climate change and urbanisation.*
The average modern building in 2050 is seamlessly integrated into a city's power supply, acting as another node in a city-wide smart grid. Nearly all buildings are able to transmit locally produced energy back into the system. Wireless electricity transfer is also common, with energy beamed invisibly between buildings, which eliminates the need for unsightly poles and cables. AI systems within each building direct its total power consumption, adjusting according to the varying needs of occupants and taking into account even the most minor of details.
Overall, this new smart infrastructure is helping to drastically improve the nature of urban living. Cities following this model are becoming far more liveable, clean, efficient and modernised. Though many regions have collapsed into chaos, others are now leading the way in providing a more sustainable path for humanity.
Smaller, safer, hi-tech automobiles
Increased living costs, lifestyle changes and environmental factors have resulted in smaller, more energy-efficient cars that are usually rented on demand rather than owned. More people than ever before are choosing to live and work alone, while the number of children per couple has also declined, which is reducing the demand for larger and more expensive vehicles.
Practically all cars in the developed world are now self-driving* and either hybrid or pure electric, while traffic flow and other road management issues are handled by advanced networks of AI. The resulting fall in congestion has boosted economies by billions of dollars. Air pollution has also declined greatly.
The inherent safety of being controlled by machine intelligence, rather than human hands, allows for greater speed of travel. An increasing number of countries are removing the speed limits on highways. Even when crashes do occur, which is extremely rare, built-in safety features and tougher materials (e.g. carbon nanotubes) mean that fatalities are becoming virtually non-existent.

A typical mid-range car of 2050.
Major advances in air travel comfort
Commercial airliners of 2050 are safer, quieter and cleaner than those of earlier decades. The vast majority are based on some form of renewable energy. Additionally, travel times have greatly improved. Hypersonic engines have seen further development, aided by the rapid growth of artificial intelligence and the resulting advances in computer-automated design evolution. It is now possible to reach anywhere on the planet in under 2.5 hours.
The interiors of most planes are breathtakingly luxurious compared to those of earlier decades. New materials have enabled the use of transparent walls and ceilings, flooding the fuselage with natural light. Seating areas are beautifully spacious and filled with a range of interactive technology.
When flights are running below full capacity, any unneeded seats are automatically shuffled to the rear, collapsed and hidden from view. The remaining seats are redistributed, rearranging themselves to offer everyone the maximum possible legroom. These seats can also morph to perfectly fit passengers' bodies. They can re-energise travellers with vitamin and antioxidant-enriched air, mood lighting, aromatherapy and acupressure treatments.* In the mid-section of the plane is a hi-tech zone offering a range of activities from virtual golf, to conference facilities and bar/lounge settings.
Recreational marijuana is legal in the majority of countries
In the late 20th and early 21st century, a number of countries began to relax their policies on cannabis. This marked the beginning of a worldwide shift in public and governmental attitudes towards the plant. Factors driving this trend included the historic and ongoing failures of prohibition, improvements in education and scientific research into the drug, greater recognition of the economic and other benefits it could provide, as well as changing voter demographics and a more relaxed approach favoured by younger generations.
During the 2010s, an estimated 3 to 5% of the global population consumed cannabis for medical or recreational purposes, making it by far the most widely used illicit substance. Among all psychoactive drugs, it ranked behind only tobacco and alcohol in popularity.
Although illegal at the federal level, individual states of the United States began to implement their own policy reforms. California had been the first state to legalise medical use of cannabis when voters approved Proposition 215, which passed with 55.6% of the vote in 1996. Many other states followed with decriminalisation and medical legalisation in the late 1990s and 2000s.
Recreational legalisation began in 2012, with Colorado and Washington becoming the first two states allowing cannabis for non-medical uses. A total of 18 states, two territories, and the District of Columbia passed such laws over the next 10 years, with decriminalisation in another 13 states and one territory. By the end of the decade, the United States accounted for 90% of the $10 billion global trade in legal cannabis.
Outside the United States, other major developments occurred during this time. In 2013, Uruguay became the first country to legalise the cultivation, sale, distribution, and consumption of marijuana. By 2022, a total of six countries had legalised recreational use – Canada, Georgia, Malta, Mexico, South Africa, and Uruguay, plus the aforementioned states and territories of the United States, as well as the Australian Capital Territory in Australia.
Contrary to popular belief, recreational marijuana in the Netherlands did not extend to full legality at this time, with consumption and sale instead being tolerated only in licensed coffeeshops alongside the decriminalisation of personal possession.
As the 2020s progressed, the market for medical cannabis saw an eight-fold expansion, from $6.8 billion in 2020, to $53.9 billion by 2030. A majority of the world's countries had legalised the drug for medical uses by 2028.
Recreational legalisation proved to be a more gradual process, however. Only five countries allowed non-medical use by 2020. Although this figure rose to around 25 by 2030 (including the United States legalising at the federal level), it remained far below the 100+ countries allowing medical use.
Following Mexico in 2021, other countries in Latin America moved to relax their policies too – Argentina, Chile, Colombia, Ecuador, Peru, and Venezuela. About a quarter of countries in Europe reformed their cannabis policies during this decade, mainly in the west of the continent. Australia and New Zealand followed the same trend as their antipodean counterparts. In Africa, somewhat faster changes occurred, led by South Africa, Ghana, Lesotho, Sierra Leone, and Zimbabwe, driven in large part by the "green rush" of economic opportunities.*
The Middle East and most of Asia progressed at a slower rate. Thailand had legalised medical use in 2018 and began moving to full legalisation, while India already maintained a de facto legalisation and tolerance in certain regions. But legalisation at the federal level remained a distant prospect for India. Elsewhere in Asia and the Middle East, many nations held strongly opposing views towards cannabis. Malaysia, for example, imposed a mandatory death penalty for convicted drug traffickers, legally defined as individuals possessing more than 200 g (7 oz) of cannabis. In Japan, public opinion polls showed that less than 15% of people thought the drug should be legally available.
By 2040, the number of countries allowing non-medical use of cannabis had reached 60, with attitudes shifting in many more parts of Europe, as well as Africa and Latin America. Opposition remained strong in the Middle East and Asia, however, despite some progress with decriminalisation and medical use. For a majority of the world's countries to legalise recreational cannabis, it would take until 2050.*
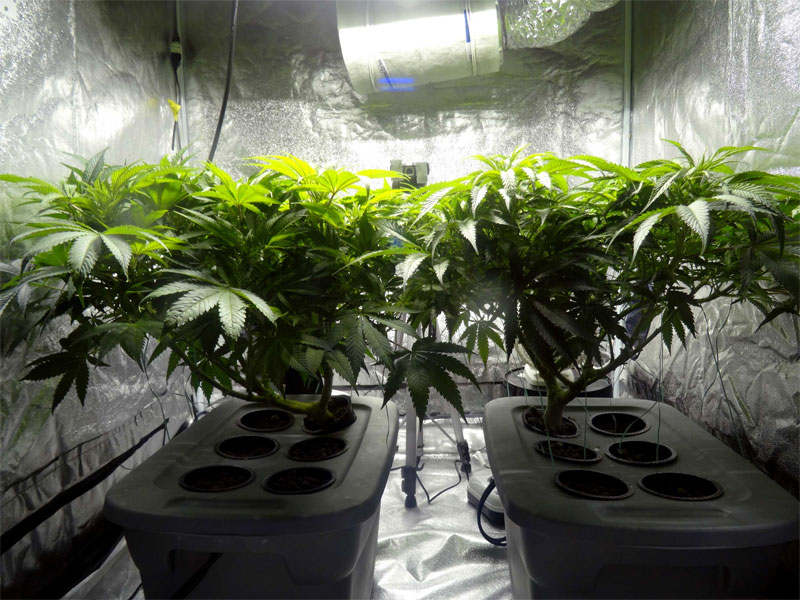
Plantlady223, CC BY-SA 4.0, via Wikimedia Commons
Continent-wide "supergrids" provide much of the world's energy needs
The need for reliable, clean, cost-effective energy has led to the creation of electrical "supergrids" across much of the world. These allow nations to share power from abundant green sources and distribute it to those regions most in need. By cooperating in this way, it is possible to greatly reduce waste and to optimise power supplies on a continent-wide scale, at all times of the year.
For instance, winter gales in the North Sea can provide a surplus of wind power, which is complemented by the summer winds of Morocco and Egypt. Meanwhile, solar panels in northern Africa generate three times the electricity compared with the same panels in northern Europe, due to much greater intensity of sunlight. Up to 100 GW of power is being supplied from Africa to Europe in this way.* Similar large-scale infrastructure is now in place throughout America, Asia and other parts of the world.
Long distance transmission technology has seen major advances over the decades. Each country is connected to the grid using high-voltage direct current (HVDC) transmission, instead of traditional alternating current (AC) lines. This results in far greater efficiency, since DC lines have much lower electrical losses over long distances.
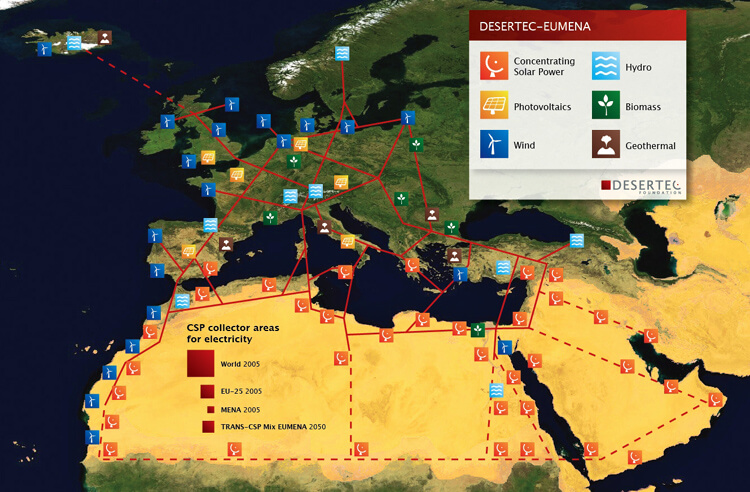
Source: DESERTEC
Foundation
China completes the largest water diversion project in history
The South-North Water Transfer Project – proposed almost a century ago* – is finally completed in China this year* at a cost of over $60 billion.* This becomes the largest project of its kind ever undertaken, stretching thousands of kilometres across the country.
Its main purpose is to divert water from the southern region of China to the dryer north. It is hoped that this will spur economic growth and stability in the more populous northern area, where the per capita share of regional water has declined to near-crisis levels. It consists of an extensive system of tunnels, dams, reservoirs and canals, all connecting and diverting water from China's largest rivers – including the Yangtze, Yellow and Hai River. At its peak capacity, the entire system can move nearly 45 billion cubic metres of water annually.
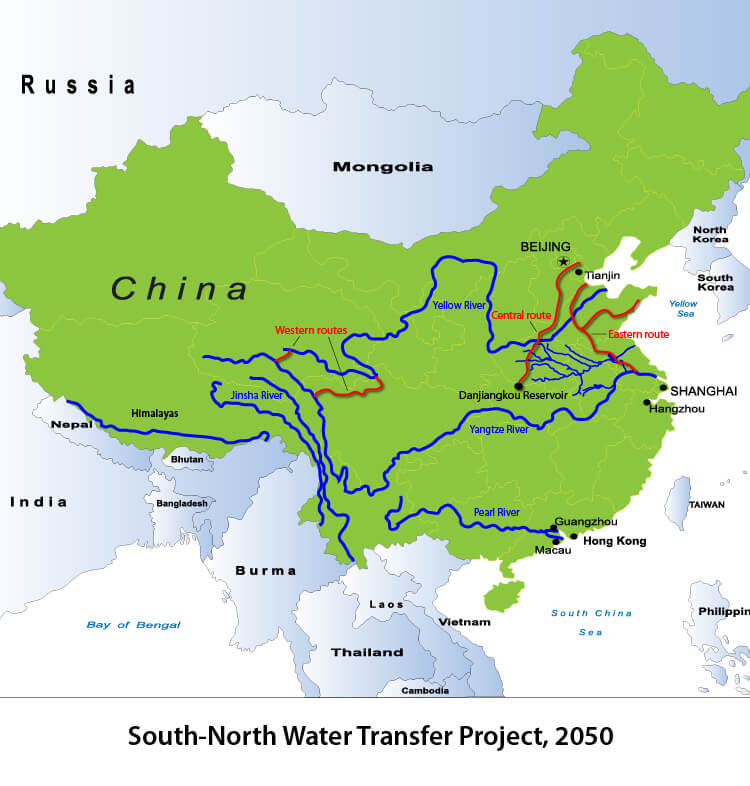
First proposed by Mao Zedong in 1952, the project was officially approved in 2002. The first stage of construction, the 717 mile (1,155 km) long eastern route, was completed in 2013. This begins near the mouth of the Yangtze, crosses through the Yellow River and ends at the Beijing-Tianjin Metropolitan area within the Bohai Economic Rim. This brings much-needed water to one of the largest and most high density conurbations in the world. Along with the construction of new tunnels and pumping stations, the Grand Canal was upgraded in order to accommodate the increased flow of water.* Adding to this is the central route, completed in 2014. This brings water from the Danjiangkou and Three Gorges reservoirs, as well as the Han River, north to Beijing and its neighbouring provinces. This totals 787 miles (1,267 km) in length and by 2030 was diverting over 13 billion cubic metres of water annually. The third and final stage to be completed is the 310 mile (500 km) western route. This involved working on the Qinghai-Tibet Plateau – from 3,000–5,000m above sea level – and posed major engineering and climatic challenges. This route diverts water from the headwaters of the Yangtze to the parched eastern plateaus.
Like the Three Gorges Dam before it, the South-North Water Transfer Project receives heavy criticism.* In addition to environmental damage through mining, construction and pollution, there are worries about the increased potential of floods in certain areas and droughts in others. Also of concern are the hundreds of thousands of people displaced from their homes during construction. Meanwhile, other diversion projects in the south have provoked conflicts with neighbouring countries.*
Many doubted that China had enough water to begin with to make the project worthwhile. Indeed, by the 2050s, southern China itself is beginning to feel the effects of melting Himalayan glaciers and drying conditions. As a result, the water diversion project rarely operates at full capacity, primarily acting as a way to evenly distribute water around China, easing tensions between the inland and coastal regions. While of some benefit to China now, in the coming years, even projects of this magnitude will be insufficient to prevent serious water shortages.* Longer term, only desalination will be able to save the country.
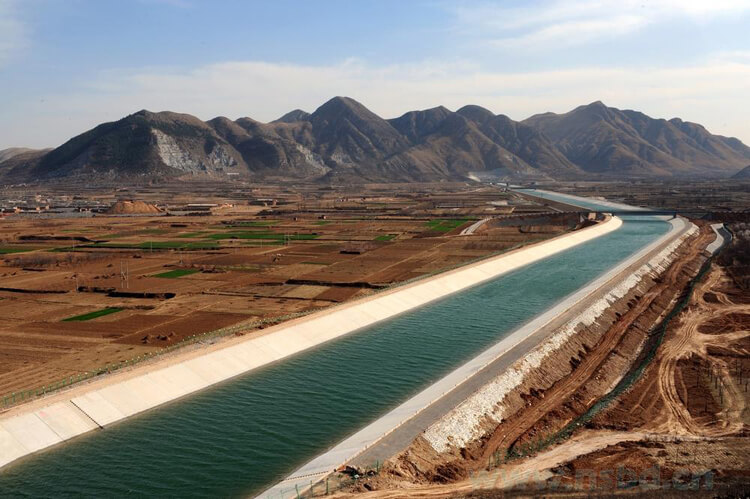
Credit: Bo Song, The Middle Route Project Construction Authority
« 2049 |
⇡ Back to top ⇡ |
2051 » |
If you enjoy our content, please consider sharing it:
References
Global
International Energy Agency (IEA):
https://www.iea.org/data-and-statistics/charts/global-co2-emissions-from-energy-combustion-and-industrial-processes-1900-2022
https://www.iea.org/reports/world-energy-outlook-2023Regions
International Energy Agency (IEA):
https://www.iea.org/data-and-statistics/charts/co2-total-emissions-by-region-2000-2023
https://www.iea.org/data-and-statistics/data-product/world-energy-outlook-2023-free-dataset-2US 2024-25
Energy Information Administration (EIA):
"We expect U.S. energy-related carbon dioxide (CO2) emissions to be relatively unchanged in 2024 from 2023 and to decrease by almost 1% in 2025."
https://www.eia.gov/outlooks/steo/report/total.phpUS 2026-2035
Climate Action Tracker:
https://climateactiontracker.org/countries/usa/EU 2024-2035
Climate Action Tracker:
https://climateactiontracker.org/countries/eu/India 2020-2070
"India's total energy-related emissions will peak around 2035 under the Stated Policies Scenarios (STEPS)."
Climate Action Tracker:
https://climateactiontracker.org/countries/india/
Wood Mackenzie:
https://www.woodmac.com/horizons/india-net-zero-path/
Japan
Climate Action Tracker:
https://climateactiontracker.org/countries/japan/
Accessed 18th June 2024.
2 How China Became the World's Leader on Renewable Energy, Yale Environment 360:
https://e360.yale.edu/features/china-renewable-energy
Accessed 18th June 2024.
3 Largest ever solar farm opens in China, Future Timeline Blog:
https://www.futuretimeline.net/blog/2024/06/5-worlds-largest-solar-farm-2024.htm
Accessed 18th June 2024.
4 China's carbon emissions set for structural decline from next year, The Guardian:
https://www.theguardian.com/business/2023/nov/13/chinas-carbon-emissions-set-for-structural-decline-from-next-year
Accessed 18th June 2024.
5 "In this report, we find there is a 70% chance that emissions start falling in 2024 if current clean technology growth trends continue and some progress is made to cut non‑CO2 emissions."
When will global greenhouse gas emissions peak?, Climate Analytics:
https://climateanalytics.org/publications/when-will-global-greenhouse-gas-emissions-peak
Accessed 18th June 2024.
6 What if global emissions went down instead of up?, Financial Times:
https://www.ft.com/content/9b11b105-6fb9-4470-ab8d-3d130fe8f26d
Accessed 18th June 2024.
7 "The International Energy Agency (IEA) finds that CO2 emissions from burning fossil fuels (by far the largest source of all emissions) will peak before 2025 based on current policies – and potentially as early as 2023."
Will 2024 be the year emissions start falling?, Climate Analytics:
https://climateanalytics.org/comment/will-2024-be-the-year-emissions-start-falling
Accessed 18th June 2024.
8 Trend over 2000 - 2050 - EnerBlue scenario, Enerdata:
https://eneroutlook.enerdata.net/forecast-co2-emissions-data-from-fuel-combustion.html
Accessed 18th June 2024.
9 For 1.5 °C, see:
CO₂ reductions needed to keep global temperature rise below 1.5°C, Our World In Data:
https://ourworldindata.org/grapher/co2-mitigation-15c
Accessed 18th June 2024.
10 For 2° C, see:
CO₂ reductions needed to keep global temperature rise below 2°C, Our World In Data:
https://ourworldindata.org/grapher/co2-mitigation-2c
Accessed 18th June 2024.
11 "Planet is headed for at least 2.5C of heating with disastrous results for humanity, poll of hundreds of scientists finds."
See World's top climate scientists expect global heating to blast past 1.5C target, The Guardian:
https://www.theguardian.com/environment/article/2024/may/08/world-scientists-climate-failure-survey-global-temperature
Accessed 18th June 2024.
12 The global economy in 2075: growth slows as Asia rises, Goldman Sachs:
https://www.goldmansachs.com/intelligence/pages/the-global-economy-in-2075-growth-slows-as-asia-rises.html
Accessed 28th March 2024.
13 Only 26% of World GDP to Come From Free Economies in 2050, Bloomberg:
https://www.bloomberg.com/news/articles/2021-12-30/only-26-of-world-gdp-to-come-from-free-economies-in-2050-chart
Accessed 28th March 2024.
Historical observed data
The Amazon Rainforest: The World's Largest Rainforest, World Rainforests/Mongabay:
https://worldrainforests.com/amazon/Land cover and transitions all over the Amazon region (1985–2023), MapBiomas Amazonia:
https://amazonia.mapbiomas.org/en/statistics/Future projections
Harmonization of global land use change and management for the period 850–2100 (LUH2) for CMIP6, Geoscientific Model Development:
https://gmd.copernicus.org/articles/13/5425/2020/IMAGE 3.2 with GLOBIO 4 land-use outputs under SSP2 scenario, PBL Netherlands Environmental Assessment Agency (2022):
https://www.pbl.nl/en/image/dataA standing Amazon Rainforest could create an $8 billion bioeconomy: Study, Mongabay:
https://news.mongabay.com/2023/07/a-standing-amazon-rainforest-could-create-an-8-billion-bioeconomy-study/Ending Deforestation in the Amazon Can Grow Brazil's GDP — but That's Not the Only Reason to Do It, World Resources Institute (WRI):
https://www.wri.org/insights/zero-amazon-deforestation-can-grow-brazil-gdp
Accessed 8th July 2025.
15 Amazon rainforest could reach 'tipping point' by 2050, scientists warn, The Guardian:
https://www.theguardian.com/environment/2024/feb/14/amazon-rainforest-could-reach-tipping-point-by-2050-scientists-warn
Accessed 9th July 2025.
16 Role of Amazon as carbon sink declines: Nature study, WMO:
https://wmo.int/media/news/role-of-amazon-carbon-sink-declines-nature-study
Accessed 9th July 2025.
17 "A new study finds that the Brazilian Amazon could be moving from being a carbon storehouse to a carbon source — putting the regional and global climate at great risk. Intensifying wildfires could contribute to that shift happening by mid-century."
See Escalating firestorms could turn Amazon from carbon sink to source: Study, Mongabay:
https://news.mongabay.com/2020/02/escalating-firestorms-could-turn-amazon-from-carbon-sink-to-source-study/
Accessed 9th July 2025.
18 Projections of future forest degradation and CO2 emissions for the Brazilian Amazon, Science Advances:
https://pmc.ncbi.nlm.nih.gov/articles/PMC9200269/
Accessed 9th July 2025.
19 Amazon savannization and climate change are projected to increase dry season length and temperature extremes over Brazil, Scientific Reports:
https://www.nature.com/articles/s41598-024-55176-5
Accessed 9th July 2025.
20 Fire and forest loss ignite concern for Brazilian Amazon's jaguars, Mongabay:
https://news.mongabay.com/2021/10/fire-and-forest-loss-ignites-concern-for-brazilian-amazons-jaguars/
Accessed 9th July 2025.
21 "...a future reduction in population size of 50% or more over the next 25 years."
See Giant Otter, IUCN:
https://www.iucnredlist.org/species/18711/222719180
Accessed 9th July 2025.
22 "Even the more optimistic scenario 'does not indicate a promising future.'"
See Deforestation, climate crisis could crash Amazon tree diversity: study, Mongabay:
https://news.mongabay.com/2019/08/deforestation-climate-crisis-could-crash-amazon-tree-diversity-study/
Accessed 9th July 2025.
23 Wildfires
set to increase 50 percent by 2050, Science Centric:
http://www.sciencecentric.com/news/article.php?q=09072853-wildfires-set-increase-50-percent-by-2050
Accessed 1st May 2010.
24 Environmentalists
say Greece disregarded climate change, EurActiv:
https://www.euractiv.com/section/climate-environment/news/environmentalists-say-greece-disregarded-climate-change/
Accessed 1st May 2010.
25 Climate change will threaten wine production, study shows, The Guardian:
http://www.guardian.co.uk/environment/2013/apr/08/climate-change-wine-production
Accessed 21st April 2013.
26 Climate change, wine, and conservation, Lee Hannah et al:
http://www.conservation.org/Documents/CI_PNAS_Climate-Change-Wine-Production-Conservation_Lee-Hannah_March-2013.pdf
Accessed 21st April 2013.
27 See 2060-2100.
28 Change in Earth's total heat content, Skeptical Science:
http://www.skepticalscience.com/graphics.php?g=46
Accessed 1st October 2012.
29 Shrinking of fishes exacerbates impacts of global ocean changes on marine ecosystems, Nature Climate Change:
http://www.nature.com/nclimate/journal/vaop/ncurrent/full/nclimate1691.html
Accessed 1st October 2012.
30 Urban population, 1950-2100, Future Timeline – Data & trends:
https://www.futuretimeline.net/data-trends/12.htm
Accessed 7th August 2022.
31 Report describes the future of buildings in 2050, Future Timeline Blog:
https://www.futuretimeline.net/blog/2013/02/14.htm
Accessed 10th March 2013.
32 Paint-on solar cells developed, Future Timeline Blog:
https://www.futuretimeline.net/blog/2011/12/23.htm
Accessed 10th March 2013.
33 Best Research Cell Efficiences, NREL:
http://www.nrel.gov/ncpv/images/efficiency_chart.jpg
Accessed 10th March 2013.
34 Potential carbon capture role for new CO2 absorbing material, Future Timeline Blog:
https://www.futuretimeline.net/blog/2012/06/12.htm
Accessed 10th March 2013.
35 Ecological Age Presentation, Arup:
http://www.youtube.com/watch?v=EbNuU21_V8I#t=5m24s
Accessed 10th March 2013.
36 City Temps May Soar From Urbanization, Global Warming, Climate Central:
http://www.climatecentral.org/news/urbanization-global-warming-could-send-city-temps-soaring-14806
Accessed 10th March 2013.
37 You won't need a driver's license by 2040, CNN:
http://edition.cnn.com/2012/09/18/tech/innovation/ieee-2040-cars/index.html
Accessed 1st October 2012.
38 Airbus
presents a panoramic view of 2050, Airbus:
http://www.airbus.com/newsevents/news-events-single/detail/airbus-presents-a-panoramic-view-of-2050/
Accessed 15th June 2011.
39 These are the Countries Most Likely to Legalize Weed Next, Vice:
https://www.vice.com/en/article/gy4pa7/these-are-the-countries-most-likely-to-legalize-weed-next
Accessed 3rd April 2022.
40 Extrapolated from the graph at 2028.
41 Saharan
sun to power European supergrid, The Guardian:
http://www.guardian.co.uk/environment/2008/jul/22/solarpower.windpower
Accessed 11th October 2009.
42 China Completes Tunnel Under Yellow River for South-North Water Transfer Project, Circle of Blue:
http://www.circleofblue.org/waternews/2012/world/update-china-completes-tunnel-under-yellow-river
Accessed 17th June 2012.
43 South-to-North Water Diversion Project, China, water-technology.net:
http://www.water-technology.net/projects/south_north/
Accessed 17th June 2012.
44 Water Wars, China Water Risk:
http://chinawaterrisk.org/big-picture/water-wars/
Accessed 17th June 2012.
45 Grand Canal (China) – South-North Water Transfer Project, Wikipedia:
http://en.wikipedia.org/wiki/Grand_Canal_of_China#South-North_Water_Transfer_Project
Accessed 17th June 2012.
46 Plan for China's Water Crisis Spurs Concern, New York Times:
http://www.nytimes.com/2011/06/02/world/asia/02water.html?_r=1&pagewanted=all
Accessed 17th June 2012.
47 Geopolitical Risks: Transboundary Rivers, China Water Risk:
http://chinawaterrisk.org/resources/analysis-reviews/geopolitical-risks-transboundary-rivers/
Accessed 17th June 2012.
48 The key effects of climate change: How water availability may change, as temperatures, population and industrialisation increase, BBC:
http://news.bbc.co.uk/1/hi/sci/tech/7821082.stm
Accessed 17th June 2012.
 |
|||||||||||||||||||||||||||||||
|
Latest predictions |
Timeline » 21st century |
Blogs » AI & Robotics |
Features » |
About us |
|||||||||||||||||||||||||||
|
|
|||||||||||||||||||||||||||||||


